Migrate from Google Analytics 4 to Matomo: User orientation
When you move from Google Analytics 4 (GA4) to Matomo, use this guide to quickly find your way around the Matomo user interface. Both tools track and analyse website traffic, but Matomo uses structures and terminology that will feel different at first.
This orientation guide explains where to find familiar analytics reports and introduces features unique to Matomo. By the end, you will understand how to navigate Matomo confidently and make the most of its privacy-friendly approach to analytics.
Getting Started
If you completed the migration from Google Analytics, Matomo tracking should now be active on your site or app. The guide focuses on helping you get oriented in Matomo rather than covering the technical setup. For installation steps and instructions on importing your Google Analytics data, read the Migration guide and tracking and site setup instructions.
GA4 Home and the Matomo Dashboard
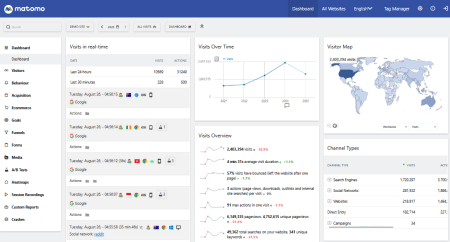
In GA4, the Home page provides an overview of recent visitor activity and event metrics. In Matomo, the Dashboard achieves the same by displaying real-time metrics and an overview of visitor activity and events.
The Matomo Dashboard is customisable where you can choose which website and reports to display, arrange them in any layout, and add as many widgets as needed. You can also create multiple dashboards for different purposes. For example, set up a dashboard focused on acquisition performance, another for Ecommerce sales, or a personal dashboard with the metrics you monitor daily.
Dashboards can be shared with teams or kept private for individual use. Learn more on how to create and customise Matomo dashboards.
Navigating Matomo Reports and Controls
The Matomo user interface includes a set of tools that you will use frequently to navigate reports and analyse data.
Global controls such as the website, date, segment, and dashboard selectors are found at the top of the Matomo screen. These allow you to adjust the scope of your analysis and switch quickly between sites, audiences, and time periods.

Within individual reports, Matomo provides tools to customise how information is displayed. You can change different visualisations such as tables, charts, or evolution graphs depending on the type of insight you need. Reports can also be exported in multiple formats (CSV, Excel, PDF, JSON, and more), making it easy to share reports or integrate them into other workflows.
Take a tour of Matomo and get an overview of the main features.
GA4 and Matomo Admin Management
In GA4, the Admin area contains account, property, and data stream settings, such as data collection, user management, and the structure of your GA setup.
In Matomo, the equivalent is the Administration ![]() section accessed by clicking on the gear icon in the top menu. This section is where you manage everything behind the scenes in Matomo. From your subscription, personal and system settings, and privacy configuration, to adding and managing sites or apps, this is your Matomo control centre. It also includes data export tools and diagnostics such as the activity log and tracking failure reports.
section accessed by clicking on the gear icon in the top menu. This section is where you manage everything behind the scenes in Matomo. From your subscription, personal and system settings, and privacy configuration, to adding and managing sites or apps, this is your Matomo control centre. It also includes data export tools and diagnostics such as the activity log and tracking failure reports.
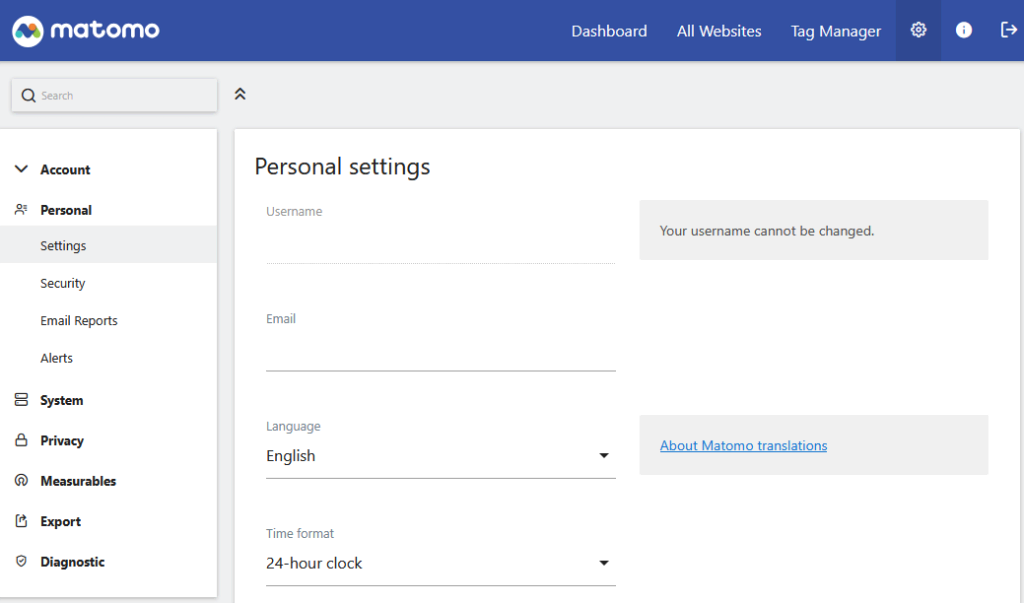
Although the Matomo Administration section contains a wide range of settings, there are a few key areas that new users should become familiar with first:
- Privacy: Configure privacy settings, data retention, IP anonymisation, and other features that help ensure compliance.
- Account: For Cloud customers, billing owners can manage the Matomo account details.
- Websites (Websites & Apps): Add new websites or apps to track, manage their settings, and configure premium features like Funnels or Heatmaps.
- System > General settings: Adjust global application settings, such as default time zone, currency, and branding.
- Users: Manage users, assign permissions, and control access to reports or administration features.
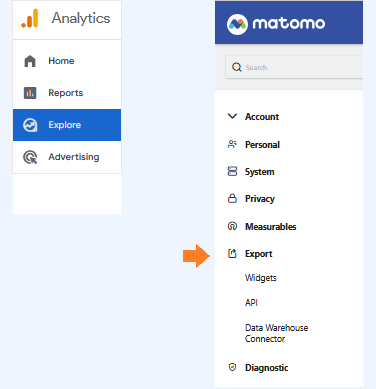
- Export > Data Warehouse connector: Set up automated exports of Matomo data to external warehouses and BI tools for advanced analysis.
- Export > API: Access the Matomo API to pull reports, integrate with other systems, or automate workflows.
These areas are the most important to explore early on to understand how your Matomo instance is structured and managed.
GA4 and Matomo Reports
Real-time Reports: Snapshots and Views
The Matomo Real-time reports provide a detailed view of current visitor activity, from live maps to individual visitor logs and profiles. You can combine reports with customisable dashboard widgets and build personalised snapshots that highlight the metrics most important to you.
The following table compares the Reports snapshot and Real-time views in GA4 to the Matomo reports.
| Reports > Reports snapshot: Snapshots are created from templates such as User behaviour, Sales and revenue, or Marketing performance. |
• Build your own personalised snapshots by customising Dashboard widgets. • Choose which website and reports to load by default in Personal settings. • Matomo > All Websites dashboard: Provides a snapshot of all websites for quick performance comparisons. |
| •Reports > Realtime overview: Shows recently active users, page views, and events for all users by default. •Reports > Realtime pages: Shows which pages are actively being viewed and how many users are on each page. |
• Matomo > Dashboard > Visits in real-time widget: Shows real-time visits and activity on your site (default view).
• Matomo > Visitors > Real-time: Gives a real-time view of visits and pages viewed with the option to replay the visitor’s session. • Matomo > Visitors > Real-time Map: Shows where active visitors are located worldwide. • Matomo > Visitors > Visitor Log and Visitor Profile: Shows a real-time detailed feed of individual visits, including pages viewed, events, actions, time spent, location, and referrer. • Segments can be applied across reports to filter data by attributes such as country, device, traffic source, or custom dimensions. |
Acquisition and Conversions: Leads, Goals and Traffic
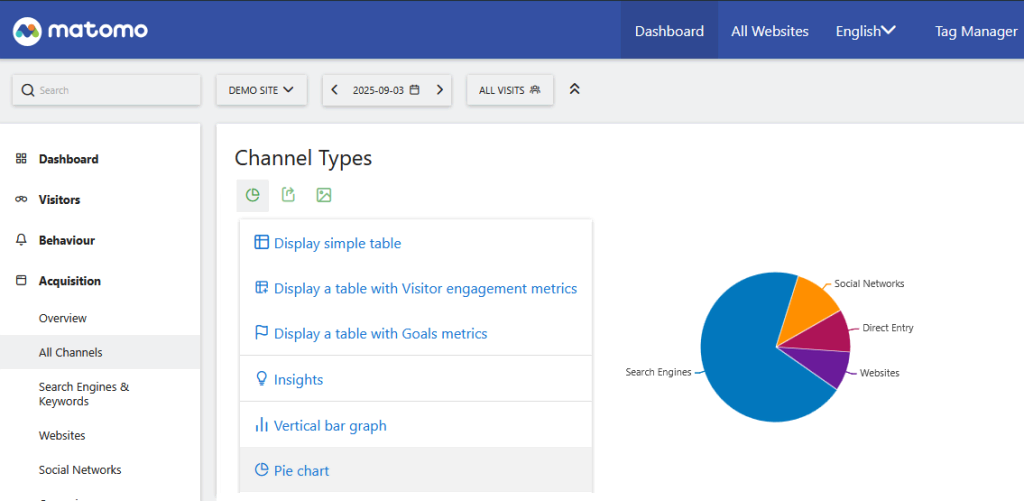
In GA4, the Business objectives > Generate leads section groups reports around lead generation goals. In Matomo, similar reports are found in Acquisition reports, where you can analyse traffic sources, campaigns, and goal conversions that represent leads.
This section shows how GA’s objective-based reports map to Matomo’s source and goal-driven approach.
| Generate leads > Overview | • Matomo > Acquisition > Overview provides a traffic summary by channel. • Build your own personalised snapshots focused on acquisition by customising Dashboard widgets. |
| Generate leads > Audiences | • Audiences are created using segments in Matomo. |
| Generate leads > User / Traffic / Lead acquisition | • Matomo > Acquisition > All Channels: Analyse traffic by referrer or campaign. • Matomo > Goals: Define a goal for conversions (e.g., form submissions, newsletter sign-ups, or demo requests) to measure how often these actions occur. • Matomo > Events: Track these actions as events. • Use Custom Dimensions to add extra context such as the type of lead, form name, or the campaign identifier as a custom dimension to break down goal conversions by specific attributes. • Use Segments to analyse leads by attributes such as country, device, campaign, or your custom dimensions (e.g. lead type). |
| Generate leads > Landing page | • Matomo > Behaviour > Entry pages: (by Page URL or Page Title): Shows the page where visits start. • Matomo > Behaviour > Exit pages: (by Page URL or Page Title): Shows the page where visits leave the site. • Matomo > Behaviour > Users Flow: Displays a visualisation of where visitors start, their navigation path through the site, and where they drop-off. |
| Generate leads > User acquisition cohorts | • Matomo > Visitors > Cohorts: This premium feature (available in Matomo Cloud) show how groups of users behave over time. Alternatively, use Custom Reports or Segments to group visitors for cohorts analysis, for example: • by when or how they first arrived (date, referrer). • by a specific action (newsletter signup, triggered event). • by purchasing behaviour (first-time buyers, product purchased). |
| Generate leads > Lead disqualification | • Matomo > Goals: Define a goal that represents disqualified leads by applying a condition (e.g, form error submissions or opt-outs). • Matomo > Events: Track these actions as events. • Use Segments or Custom Dimensions to filter or isolate disqualified leads in your reports. |
Ecommerce Performance: Revenue, Orders and Products
In GA4, the Business objectives > Drive sales section groups reports around Ecommerce performance. In Matomo, Ecommerce reports let you analyse revenue, orders, product sales, and customer purchasing behaviour.
This section explains how the Ecommerce reports in GA4 compares to Matomo.
| Drive sales > Overview | • • Matomo > Ecommerce > Overview: Provides a summary of Ecommerce metrics for the selected date range including the Conversions Overview and Sales Funnel report (if enabled). • Matomo > Ecommerce > Ecommerce Log: Shows granular session-level data for each visitor who made a purchase or abandoned their cart. |
| Drive sales > Ecommerce purchases / Transactions | • Matomo > Ecommerce > Sales: Provides detailed Sales reports by referrers, pages, engagement, user location, and user attribute. • Matomo > Ecommerce > Products: Provides detailed Product reports on product-level performance, including product views, purchases, and revenue generated. |
| Drive sales > Promotions | • Matomo > Events: Promotions can be tracked as custom events or dimensions. |
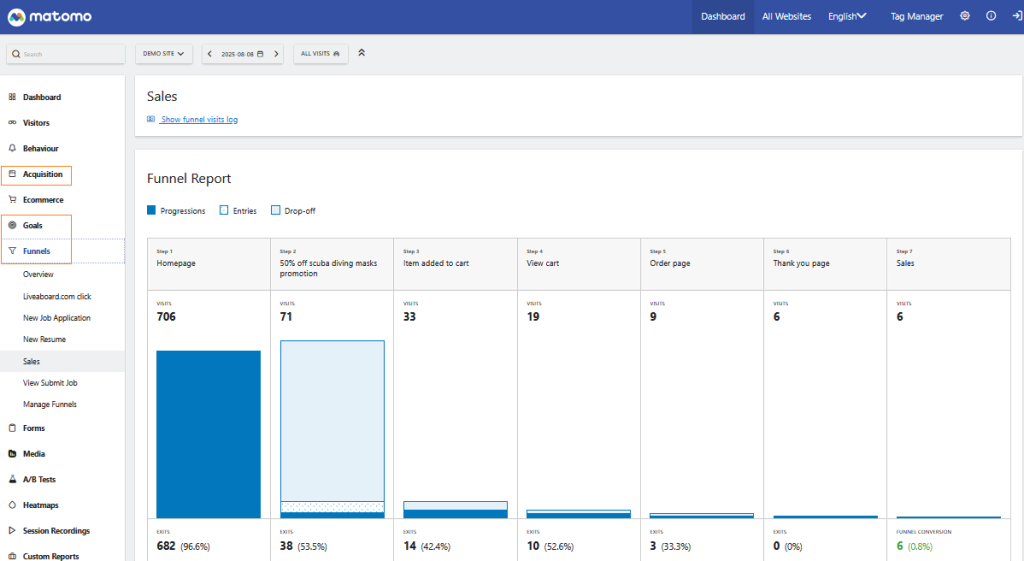
| Drive sales > Purchase journey / Checkout journey | • Matomo > Funnels: This premium feature (available in Matomo Cloud) provides a visualisation of the checkout journey where you can identify drop-off points and optimise the purchase process. |
Visitors Overview: Understanding website/app traffic
In GA4, the Business objectives > Understand web/app traffic section groups reports that provide an overview of visitor activity, demographics, and content performance. In Matomo, similar insights are available in the Visitors and Behaviour reports, where you can analyse where your visitors come from and how they interact with your site or app.
| Understand web/app traffic > Overview | • Matomo > Visitors > Overview: Shows a summary of visits and actions for any selected date range. It goes beyond real-time by showing patterns in behaviour, device use, and return visits. |
| Understand web/app traffic > Demographic details | • Matomo > Visitors > Location: Geographic reports by country, region, and city. • Create Custom Dimensions for demographic attributes like age, gender, or membership type. |
| Understand web/app traffic > Pages and screens | • Matomo > Behaviour > Pages: Visits, unique pageviews, average time on page, and bounce rate. • Matomo > Behaviour > Entry/Exit pages: Entry and exit points for user sessions. |
Visitor Engagement: Understanding behaviour
In GA4, the Business objectives > View user engagement & retention section groups reports that measure how users interact with your website or app. In Matomo, the Behaviour reports let you analyse user actions, page interactions, site searches, and more.
This section explains how GA4’s engagement and retention reports compare to their equivalents in Matomo.
| View user engagement & retention > Overview | • Matomo > Visitors > Overview: Shows a summary of visits and actions for any selected date range. It goes beyond real-time by showing patterns in behaviour, device use, and return visits. |
| Understand web/app traffic > Demographic details | • Matomo > Behaviour > Engagement: Shows a summary of how visitors interact with your site, including visit duration, number of actions per visit, and frequency of returning visits, and recency of visits. |
| View user engagement & retention > Events | • Matomo > Behaviour > Site Search (if enabled): Tracks searches as events. • Matomo > Behaviour > Outlinks: Shows clicks on links that take visitors away from your site to external domains. • Matomo > Behaviour > Downloads: Tracks clicks on file download links (e.g. PDFs, images, software). • Matomo > Behaviour > Contents: Reports on content impressions and page interactions. • Matomo > Behaviour > Events: Report on custom events with categories, actions, and names. |
| View user engagement & retention > Pages and screens | • Matomo > Behaviour > Pages: Visits, unique pageviews, average time on page, and bounce rate. |
Visitor Insights: Demographics and Audiences
In GA4, the User reports provide details about who your visitors are, including their demographics, attributes, and audiences. In Matomo, similar insights are found in the Visitors and Behaviour sections. These reports help you understand visitor identity, location, technology, and activity patterns.
| User attributes > Overview / Demographic details | • Matomo > Visitors > Visits Log: Displays a chronological log of individual visits, including actions, referrer, location, and device details. • Matomo > Visitors > Locations: Reports on visitor geography, broken down by country, region, and city. • Matomo > Visitors > Devices: Shows device type, brand, model, and resolution used by visitors. • Matomo > Visitors > Software: Details on operating systems, browsers, browser versions, and browser plugins. • Matomo > Visitors > Times: Analyse visits by local time, server time, day of the week, and visit duration. • Matomo > Behaviour > User IDs: Tracks and reports on logged-in users (if User ID tracking is implemented). • Create Custom Reports for specific visitor attributes. • Create Custom Dimensions for demographic attributes like age, gender, or membership type. |
| User attributes > Audiences | • Audiences are created using segments in Matomo. Segments let you group visitors by shared characteristics or behaviours, such as campaign origin, goal completions, or device type. |
Visitor Technology: Devices and Browsers
| Tech > Overview | • Matomo > Visitors > Devices: Overview of visitor technology, including device types, OS, and browsers. |
| Tech > Overview | • Matomo > Visitors > Software: Shows a detailed breakdown of operating systems, browsers, browser versions, and plugins. |
GA4 Library and Matomo: Custom Reports
In GA4, the Library organises report collections. In Matomo, this feature is filled by Custom Reports. These can be added as a dashboard widget and grouped into categories and subcategories for easier navigation. You can design reports with the dimensions, metrics, and visualisations needed for ongoing analysis. Read more about how to create and analyse Custom Reports in Matomo.
GA4 Explorations and Matomo: Advanced Reporting
GA4 Explorations allow for deep analysis. In Matomo, advanced exploration is supported through Custom Reports, integration with Looker Studio, and Data Warehouse exports for BI tools.
These options let you dig into detailed data, create tailored dashboards, and combine Matomo insights with other sources.
GA4 Advertising and Matomo: Measuring Marketing Performance
GA4’s Advertising section shows campaign effectiveness. In Matomo, similar insights are provided through Acquisition reports, as well as Goals and Funnels. Together these reveal how campaigns drive traffic, conversions, and revenue.
Matomo Premium Features
While GA4 and Matomo both provide standard engagement and retention reporting, Matomo also offers premium features for richer insights into visitor behaviour.
- Custom Reports: Build tailored reports by choosing the dimensions, metrics, and layouts that best match your analysis needs.
- A/B Testing: Test variations of pages or features to see which version drives better results.
- Heatmaps: Visualise where users click, scroll, and move their mouse on a page.
- Session Recording: Replay user sessions to understand real navigation patterns.
- Media Analytics: Track interactions with videos and audio, including plays, pauses, and completions.
- Form Analytics: Analyse form usage to detect drop-offs, completion rates, and problem fields.
- Cohorts: Analyse how groups of users who share a common characteristic (such as acquisition date or first purchase) behave over time, and measure their retention or engagement patterns.
- Multi-channel conversion attribution: Analyse how different marketing channels contribute to conversions across the full customer journey. Matomo lets you compare attribution models (first-click, last-click, position-based) to understand the true impact of each channel.
By now, you’ve seen how Matomo’s reports, settings, and unique features give you a full picture of traffic, engagement, and performance. Whether you’re exploring acquisition channels, configuring privacy options, or diving into advanced tools like Funnels, Heatmaps, and A/B testing, Matomo equips you with the flexibility to track what matters most to your organisation.
You can also explore the Matomo Integrations page, for WordPress, APIs for reporting, consent manager platforms (CMP) and more!