


10 web analytics tools to consider in 2026
Whether you’re a marketing manager looking at the ROI of campaigns, a web analyst focused on conversions or simply interested in learning more about web analytics, there’s something for you on this list.
1. Matomo
Matomo is the leading open-source, privacy-focused web analytics software that helps teams make more informed decisions and enhance customer experiences while being designed to support GDPR compliance and user privacy.
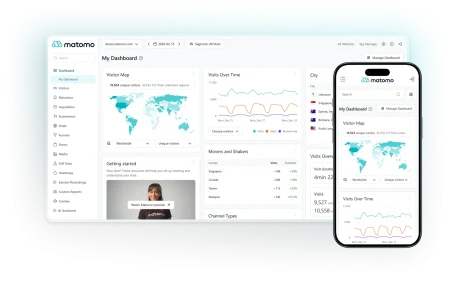
Over 1.4 million websites trust Matomo in 190+ countries and 50+ languages. It’s an ethical analytics solution with traditional web and behavioural analytics and other advanced features, including Roll-up Reporting, a Tag Manager and a built-in GDPR Manager.
Key features:
- Shows referrals from AI assistants and activity from AI agents and chatbots, so you can see how AI tools discover and access your content.
- Heatmaps and Session Recordings show what users are clicking on and how they’re interacting with different page elements
- A/B testing to compare alternate versions of the same content and see which gets better results
- APIs to connect your data to other platforms, like data visualisation or business intelligence tools
Strengths:
- Free, open-source software
- Offers On-Premise and Cloud-hosted options
- Designed to support GDPR compliance and user privacy
- Complete data ownership
Limitations to consider:
- On-Premise is free, but that means an additional cost for advanced features (A/B testing, heatmaps, etc.) that are included by default on Matomo Cloud.
- Matomo On-Premise requires servers and technical expertise to set up and manage.
Integrations:
Easily integrates with 100+ other tools and platforms, including WordPress, Looker Studio, Magento, Jira, Drupal, Joomla and Cloudflare, alongside its APIs and open-source architecture.
Pricing:
- Varies based on monthly hits
- Matomo On-Premise: free
- Matomo Cloud: starting at €22/month
Start your 21-day free trial now, no credit card required.
2. Adobe Analytics
Adobe is a trusted name in software, with tools like Photoshop and Illustrator that have been around for decades.
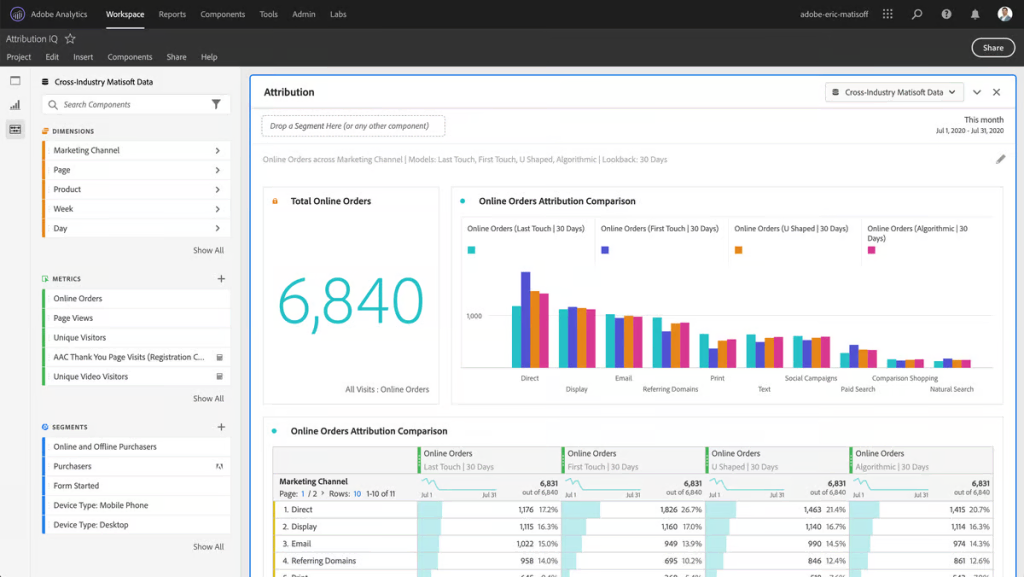
Order attribution comparisons in Adobe Analytics
(Image source)
Adobe Analytics offers insight into customer acquisition and retention, ROI and ad campaign performance. Its machine learning (ML) and AI-powered analytics use historical data to predict future customer behaviour.
Key features:
- Multichannel data collection that covers computers, mobile devices and IoT devices
- Adobe Sensei (AI/ML) for marketing attribution and anomaly detection
- Tag management through Tags in Adobe Experience Platform simplifies the tag creation and maintenance process to help track how users interact with the site.
Strengths:
- When integrated with other Adobe software, it becomes a powerful solution for enterprises
- Saves teams a lot of time with the recommendations and insights automatically generated by Adobe’s AI/ML
Limitations to consider:
- Quote-based pricing only
- Enterprise focus
Integrations: Integrates with Adobe Experience Manager Sites, the company’s CMS, and Adobe Target, Adobe’s CRO tool.
Pricing: Select, Prime and Ultimate packages with quote-based pricing
3. Google Analytics 4
Despite many users’ dissatisfaction, GA4 isn’t going away anytime soon. It’s still a powerful tool with all the standard features you’d expect. It’s the most popular choice for web analytics for a few other reasons, too, including:
- It’s free to use.
- It’s easy to set up.
- It has a wealth of user documentation and technical resources online.
- Its machine-learning capabilities can offer insights into user behaviour and how to grow your site.
- It integrates easily with other Google tools, like Google Search Console, Google Ads and Google Cloud.
That said, it comes with some serious drawbacks. Many users accustomed to UA have reported being unhappy with the differences between it and GA4. Their reasons range from changes to the user interface and bounce rate calculations to Google’s switch from pageview-focused metrics to event-based ones.

GA4 Acquisition Overview dashboard
(Image source)
Let’s take a look at some limitations to consider:
- Privacy and advertising settings require careful configuration. Google Analytics has configurable data-sharing controls, while linked Google products and advertising settings affect how data can flow and be used.
- Cookie consent banners can frustrate visitors, and with 40-60% of web visitors rejecting consent, relying on them can lead to inaccurate data and an incomplete view of your web traffic and campaign outcomes.
- Users can’t import data from UA to GA4.
- Explorations and ad-hoc queries can be sampled when a standard property exceeds 10 million events per query. Common reports can use aggregated tables that return unsampled results.
4. Mixpanel
Mixpanel offers web and mobile product analytics. It tracks events across websites and apps, from page views and feature interactions to sign-ups, purchases and other product events.
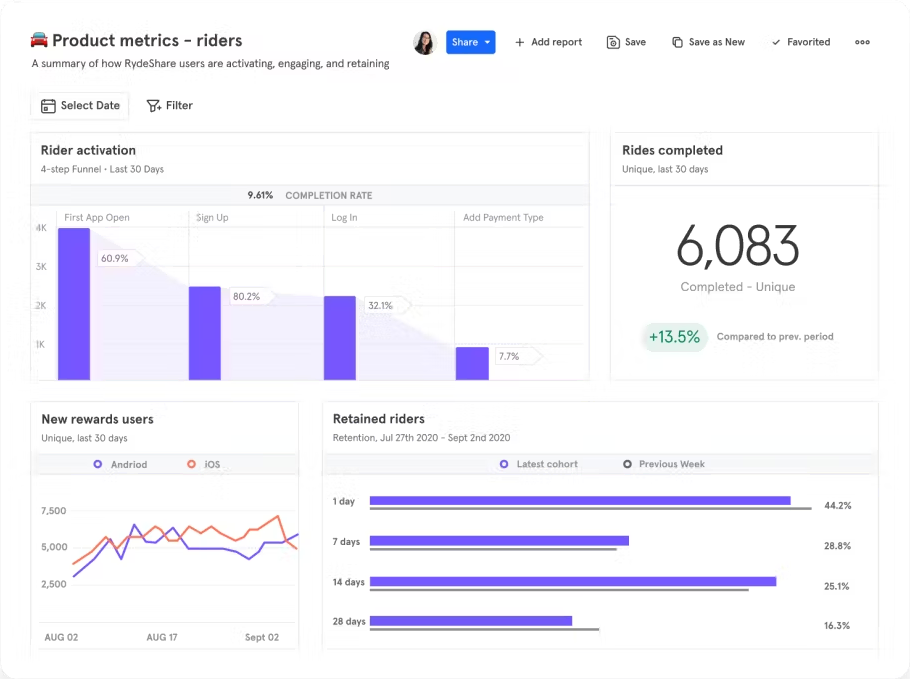
Mixpanel product analytics dashboard for a ride-sharing app
(Image source)
Similar to GA4, Mixpanel is an event-focused analytics platform. While it will still track pageviews, its main focus is on the specific actions users take that lead them to purchase. Focusing on this information helps teams identify specific events and reveals how users move through the sales funnel.
Mixpanel offers Warehouse Connectors, which simplify the process of importing data lakes and data warehouses.
Key features:
- Custom alerts and anomaly detection
- Boards, which allow multiple reports and insights to be shared with a team in a range of visual styles
- Detailed segmentation reporting that breaks down data to the individual user, specific event or geographic level
Strengths:
- Boards allow for emojis, GIFs, images and videos
- Powerful mobile analytics for iOS and Android apps
- Free promotional credits for eligible startups
Limitations to consider:
- Limited features in the free plan
- Steep learning curve
Integrations: Mixpanel integrates with tools including Figma, Google Cloud, Slack, HappyFox, Snowflake, Microsoft Azure, Optimizely, Mailchimp and Tenjin. It also has a WordPress plugin.
Pricing:
- Free: up to 1 million monthly events and five saved reports per seat
- Growth: starts at $0, with the first million events included and usage-based pricing above that
- Enterprise: contact sales
5. HubSpot Marketing Hub
HubSpot is a customer relationship management (CRM) platform with marketing, sales, customer service, content management system (CMS) and operations tools. This greater ecosystem of HubSpot software allows an entire business to be run in one place.
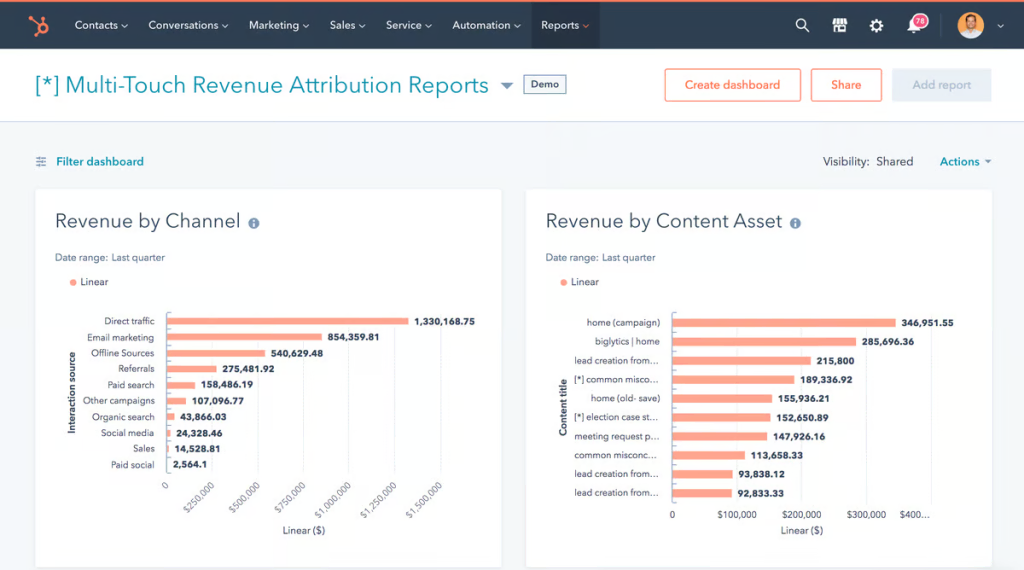
HubSpot’s multi-touch revenue attribution report dashboard
(Image source)
Customer journey analytics is available with Marketing Hub Enterprise, Sales Hub Enterprise and Service Hub Enterprise. It connects interactions and stages across contacts, deals or tickets. It’s worth considering for companies that are already using HubSpot to host their web properties and don’t need more advanced capabilities.
Key features:
- Customer Journey Analytics presents the steps customers take through the sales process in a step-by-step, visual way
- Dashboards for reports, including both fully customisable options for power users and pre-made templates for new users
Strengths:
- Integration with other HubSpot tools, like HubSpot CRM’s free live chat widget
- User-friendly interface with many features being drag-and-drop, like the report dashboard
- 24/7 customer support, depending on plan
Limitations to consider:
- Expensive upgrades and add-ons
- Lacking advanced features like heatmaps
- Some users report customer support is unhelpful
Integrations: The larger HubSpot CRM platform can connect with 2,000+ other apps through the HubSpot App Marketplace. These include Slack, Microsoft Teams, Salesforce, Make, WordPress, SurveyMonkey, Shopify, Stripe, WooCommerce and hundreds of others.
Pricing:
- Starter: $20/month per seat
- Professional: $890/month
- Enterprise: $3,600/month
6. Kissmetrics
Kissmetrics is a web analytics tool marketed to SaaS and ecommerce companies. It’s labelled “person-based” because it combines event-based tracking with detailed user profiles of visitors on a site to offer valuable insights into customer behaviour.
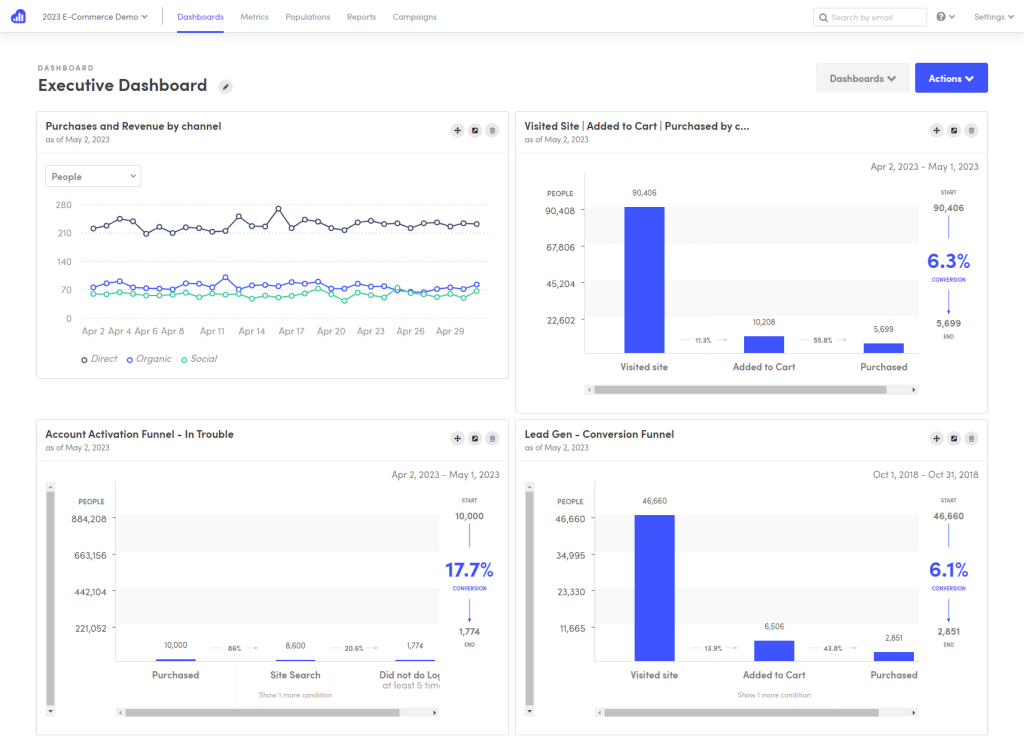
Kissmetrics’ executive dashboard
(Image source)
It allows teams to drill down into user profiles to see how many times someone visited the site, whether they bought anything, and the steps they took before completing a purchase. This gives teams the details they need to cater more to their users and drive growth.
Key features:
- Person Profiles that give granular information about individual users and their activities on your site
- Campaigns, an engagement messenger application, automates emails when triggered by specific events
- Detailed reporting tools
Strengths:
- No third-party cookies
- No data sampling
- APIs for Ruby on Rails, JavaScript, Python and PHP
Limitations to consider:
- Difficult installation
- Advanced reporting features aren’t part of the free plan
- Slow loading times
- Doesn’t track demographic data, bounce rate, exits, session length or time on page
Integrations: Kissmetrics integrates with HubSpot, Appcues, Slack, Mailchimp, Shopify, WooCommerce, Recurly and 30+ others. It also has a Kissmetrics WordPress plugin.
Pricing:
- Free: up to 100,000 events/month
- Growth: starts at $99/month from 500,000 events ($0.20 per 1k events)
- Silver: $0.15 per 1k events at 5M events
- Gold: $0.10 per 1k events at 5M events
- Custom: from 5M events
7. Contentsquare (formerly Hotjar)
Like all web analytics tools, Contentsquare helps organisations understand users’ website behaviour. It also allows them to identify pain points or usability issues causing high bounce rates.

Contentsquare movement heatmap shows where visitors move their mouse
(Image source)
It combines Heatmaps, Session Replay, Surveys and Feedback, Funnels, Error Monitoring and Performance Monitoring to reveal how visitors engage with a website. These tools offer critical insight and feedback on a website’s performance and user experience. They are also helpful for streamlining usability testing of new or relaunched websites.
Key features:
- Heatmaps
- Session Replay
- Surveys and feedback
- Funnels
- Error Monitoring and Performance Monitoring
Strengths:
- User-friendly interface
- Easy to set up
Limitations to consider:
- Limited data retention for free users
- Limited reporting capabilities compared to other tools
Integrations: Contentsquare Free includes 10+ integrations, including Slack, Jira and Unbounce.
Pricing:
- Free: up to 200,000 sessions/month
- 15-day Growth trial
8. Chartbeat
Chartbeat was developed specifically for content creators, publishers and marketers.
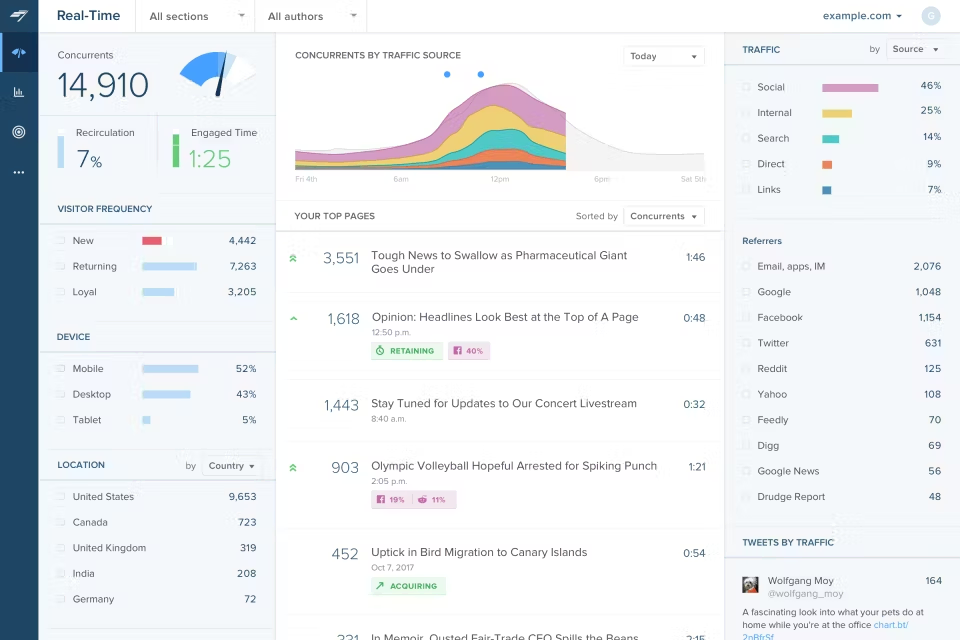
Chartbeat’s dashboard shows active readers, scroll depth and traffic sources.
(Image source)
Chartbeat focuses on immediate data, allowing users to see how their audience engages with content as it happens. This immediacy helps teams make informed decisions on the fly, whether they’re adjusting headlines, promoting articles, or timing social media posts. Chartbeat’s dashboard provides live insights into active readers, scroll depth, and traffic sources, enabling a deeper understanding of audience behaviour.
Key features:
- Live analytics that show engagement metrics
- Content optimisation tools that suggest improvements based on audience interaction
- Alerts for significant traffic changes or engagement drops
Strengths:
- Intuitive interface that’s easy to navigate
- Strong focus on immediate data
- Integrates easily with various content management systems
Limitations to consider:
- Pricing may be steep for smaller publishers
- Some users report occasional glitches in data reporting
Integrations: Chartbeat integrates with platforms like WordPress, Google Analytics, and social media networks for enhanced tracking.
Pricing: Essentials, Plus, Premium and Enterprise, with pricing based on website/native-app pageviews and a sales enquiry.
9. Similarweb
Similarweb is a market intelligence platform that offers valuable insights into website performance and competitive analysis. It collects website data in the form of traffic and engagement metrics, SEO and PPC keywords and data on brand preferences, audience interests, traffic sources and popular pages.
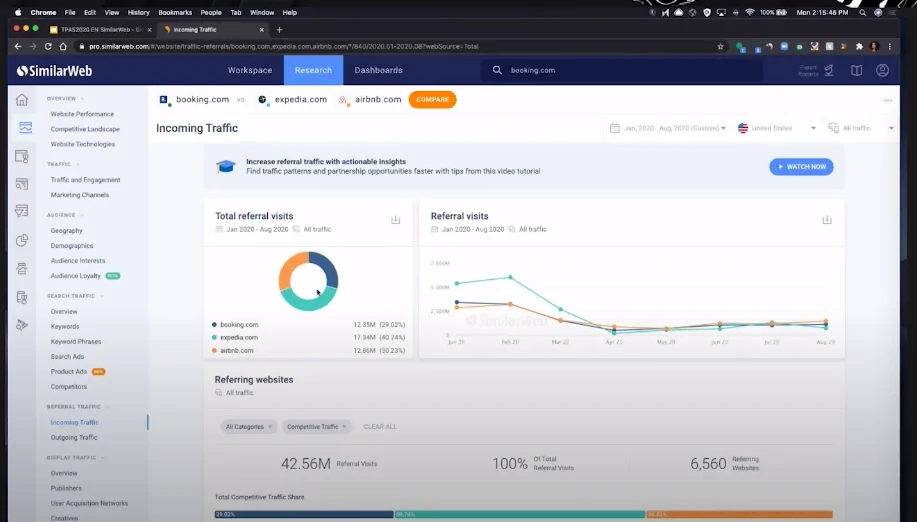
Similarweb’s incoming traffic dashboard
(Image source)
Similarweb estimates total traffic and breaks it down by channel. Its modelling combines direct first-party measurement, a contributory network, partnerships and public data. This allows effective comparison and benchmarking against any competitor, anywhere in the world. It also makes it possible to compare brand-specific data to understand why some are more popular.
Key features:
- Total traffic analytics that break down visitor numbers by source
- Competitor benchmarking to compare a site against others in the industry
- Audience insights to understand user demographics and interests
- SEO tools to enhance search visibility
Strengths:
- User-friendly interface
- In-depth competitive analysis
Limitations to consider:
- Premium features can be costly
- Some data may be less accurate for smaller websites
- Limited customisation options for reports
Integrations: Similarweb integrates with Google Analytics, HubSpot, and other marketing tools to streamline data analysis.
Pricing: Free data is based on a limited high-level sample. Paid Web Intelligence currently starts at $125/month billed annually. Similarweb offers a free trial. Individual contract pricing has three tiers:
- Competitive Intelligence: $125/month billed annually or $199 month-to-month
- Competitive Intelligence + SEO + AEO: $333/month annually or $399 monthly
- Competitive Intelligence + SEO + AEO + Ads: $542/month billed annually or $649 monthly
Custom pricing applies to teams and enterprises.
10. Google Search Console
Google Search Console was initially designed as Google’s technical SEO tool. But it’s now a useful free tool that helps website owners understand and optimise their site’s positioning in search engine results.
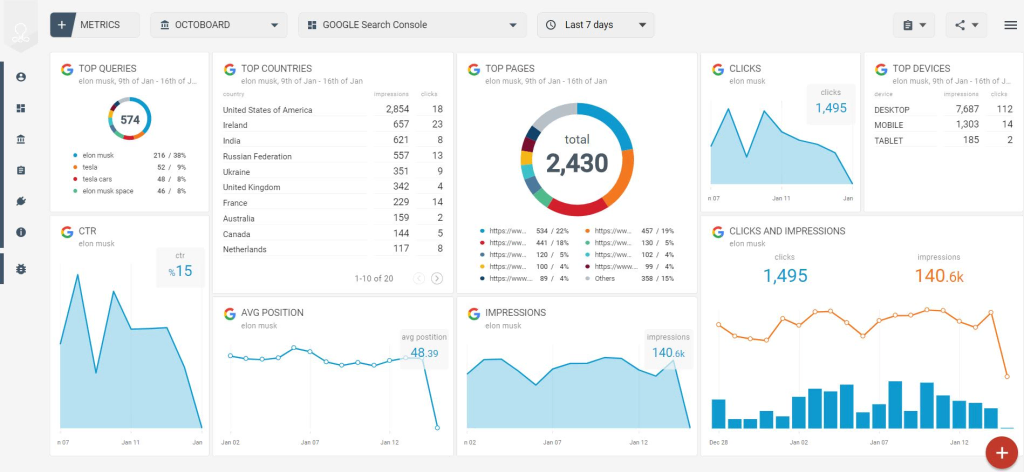
Google Search Console dashboard with Google Search performance and indexing data
(Image source)
It also tracks website performance and helps web property owners and managers diagnose issues. However, it is limited if a complete view of traffic is needed. It can’t offer insight into how users behave on a website.
Key features:
- Performance reports that show clicks, impressions, and average position for your pages
- URL Inspection tool for checking indexing/indexability, structured data, video and AMP information
- Page indexing report that highlights issues preventing your pages from appearing in search results
Strengths:
- Free to use
- Helpful Google Search performance and indexing data
- URL inspection and indexing reports
Limitations to consider:
- Overwhelming for beginners
- Limited historical data
- Lacks detailed demographic information
Integrations: Works seamlessly with Google Analytics and other Google services
Pricing: Google Search Console is free to use.


