Analyse Funnels
Funnel reporting can help you better analyse the actions that you expect your visitors to take as they progress through your website by reporting on individual funnel steps. This enables you to granularly optimise each step to increase the number of visitors that reach your desired outcome.
Where to find Funnel Reports
From the Matomo dashboard, go to Funnels in the main reporting menu. Open the Overview page for a summary of all funnels as well as individual funnels listed with conversion details.
If you do not have any funnels configured, the following message is displayed.
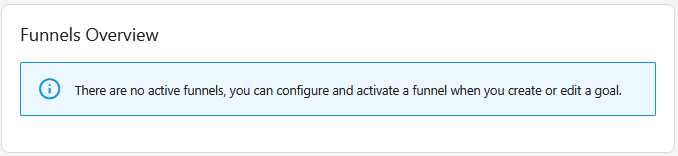
To start using funnels, follow this guide to configure your first funnel.
Funnels Overview Page
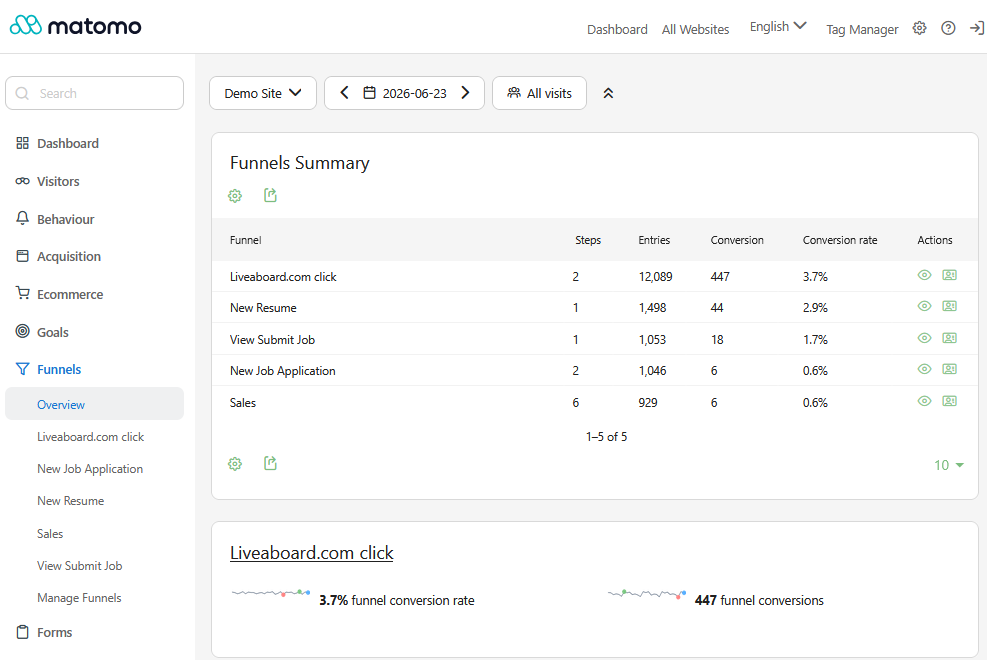
The Funnels Overview page provides a high-level view of all active funnels in your Matomo instance.
Funnels Summary
Available from Funnels plugin version 5.5.0, the Funnels Summary table report displays key metrics for each funnel, including the number of steps, entries, conversions, and conversion rate. This makes it easy to compare funnel performance and identify which journeys are producing the strongest results.

The summary includes an Action column with options to:
- Click the eye icon
 to view a table report on Entries and Exits.
 - Click the profile icon to open the segmented visits log.
Active Funnels
Below the summary table, each active funnel is displayed in its own card. These cards show the funnel conversion rate, total number of funnel conversions, and trend sparklines for a quick performance snapshot.
The Overview page is useful for monitoring multiple funnels at once. To investigate a specific funnel in more detail, click the funnel name in either the summary table or the funnel card to open the detailed funnel report.
Funnel Report Page

The funnel report page consists of five main sections which are described below.
Funnel Overview Card
The Funnel overview primarily provides shortcuts to actions related to the funnel. For example:
Show funnel visits log
This is a useful feature for getting granular detail on exactly how each user completed (or did not complete a funnel). By reviewing individual sessions with this feature, you may be able to identify how people are getting diverted from your funnel. Additionally, if you use Matomo’s crash analytics feature, it may reveal errors at a certain funnel step on your website or application. You can learn more about analysing Visits Logs in this guide.
Show goal report
If the funnel was created as part of a goal, the option to view the report specific to that goal will be available.
Edit funnel
If you have write permission, the option to edit the funnel will be displayed.

Funnel Report
The second section of this page is the Funnel Report. This is a visual overview of your visitors’ progression through the funnel. Each stage shows the number of entries (people joining your funnel at this stage) and exits (people abandoning your funnel at this stage). A bar helps show the breakdown of visitors for each step and provides even more detail when you hover it.

Funnel Details
This table supports the Funnel Report by providing a more comprehensive breakdown of the metrics for each step. It also has actions that allow viewing even more in-depth information such as the entries and exits, visitor log, and evolution segmented by step.
Funnel Row Evolution Graph
This report shows you the Funnel conversion rate over time by default. However, you can customise which metrics are displayed by clicking on the line chart icon ![]() at the top left of the chart. This allows you to plot different funnel metrics and even compare them against each other.
at the top left of the chart. This allows you to plot different funnel metrics and even compare them against each other.

You can customise this chart and export the data with all the standard row evolution graph features available in Matomo. However, most importantly for funnel analysis, you can confirm which metrics are plotted by referring to the colour key at the top of the chart.

You can change the reporting range by using the data selectors at the top of the page. To set reporting intervals, click the calendar icon ![]() below the graph to make a selection. Additionally, you can change the number of periods displayed with the numeric drop-down item at the bottom right.
below the graph to make a selection. Additionally, you can change the number of periods displayed with the numeric drop-down item at the bottom right.
Funnel Sparkline Summaries
These are the same as the simplified reports displayed on the Funnel overview page. They show you the funnel conversion rate and actual number of conversions. There is also a small orange marker which shows you the lowest point in time and a blue marker for the highest point in time. These simplified sparkline charts follow the same date range as is selected for the full row evolution chart.

You can also apply segments to your Funnel reports.
Did you know? Funnel reports are shown in the Matomo Mobile app and they work with both Scheduled Reports and Custom Alerts.