Manage, track and analyse forms
Form Analytics is a premium feature which is included in Matomo Cloud Business plans or you can purchase it on the Matomo Marketplace for Matomo On-Premise. Learn more about all the benefits and features of Form Analytics.
Managing your Forms
Open Matomo and go to Administration ![]() > Measurables > Forms.
> Measurables > Forms.
By default, Matomo will automatically discover your online forms and create a new form in Matomo whenever it discovers a new form. No developer knowledge is needed to configure any of these forms as Matomo does most of the work automatically. In addition, the UI always explains what each step is about in detail.
Note: If the formId starts with hs, it will be ignored for auto form creation and you will need to add the form manually.
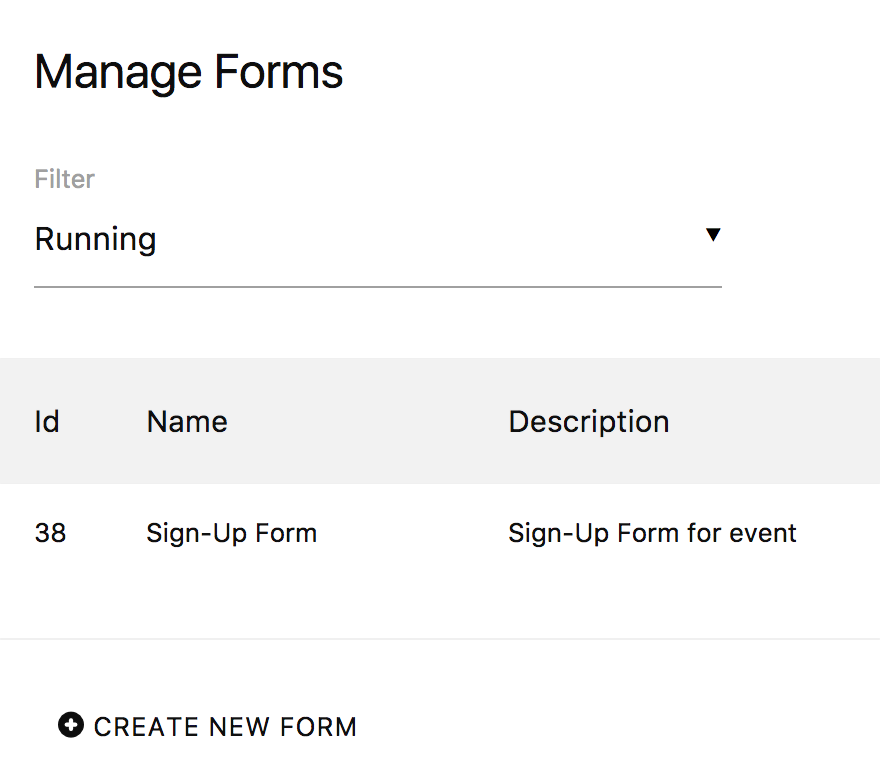
Creating and editing a form
To create a form, click on Create New Form. To edit a form, simply click on the edit icon next to the name of an existing form.
Matching your forms
The first section does not usually need to be changed as it is automatically configured by Matomo. It lets you specify which of your online forms should be tracked into this form. You can do this by defining criteria based on form names and form IDs. If you want to, you can track many different forms into one form in Matomo. You can also leave these fields empty and track a form only by its page URL or URL path.
Restricting the tracking to certain pages
The next step usually doesn’t need to be changed either. It lets you optionally restrict the tracking of a form to only some pages. This is useful when you have the same form embedded on various pages, but only want to track the data on some of those pages.
Defining form conversions
This is the most important step in your form configuration where you define when a form should be considered as completed successfully. A conversion occurs when the user successfully submits your form (for example, to send your team a message, signup as a customer, register for an event or purchase an item). Matomo differentiates between form submits and form conversions because often users have to submit a form several times before they fix all validation errors and complete the form.
The same form can convert multiple times during a single visit. For example, if a form appears on more than one page of your site, each successful submission is tracked as a separate form conversion. However, if you are tracking form conversions as goals, the goal definition will determine if multiple conversions are allowed per visit. Learn more on multiple goal conversions.
Tracking your online and web forms
In most cases, the plugin automatically starts the tracking of how visitors interact with your forms on your website or web application.
Learn more about setting up Form Analytics tracking on our Developer Zone.
Viewing Form Reports
Navigate to Matomo > Forms and then select a Form report of your choice.
Overview
The Overview report gives you an overview over all your form metrics and how they evolve over time. See at a glance, whether more people start interacting, submit and convert your forms. Find out if they spend more time filling out, or if any other metric changes significantly and needs further investigation.
The two most important metrics are often the form starter rate, and the form conversion rate. The form starter rate lets you know how many people start filling out the form, after seeing it. The form conversion rate lets you know how many of those people who started filling out your form, also completed it. Improving those two rates typically involves different changes and the upcoming reports are optimized to let you find out what you need to change to become more successful.
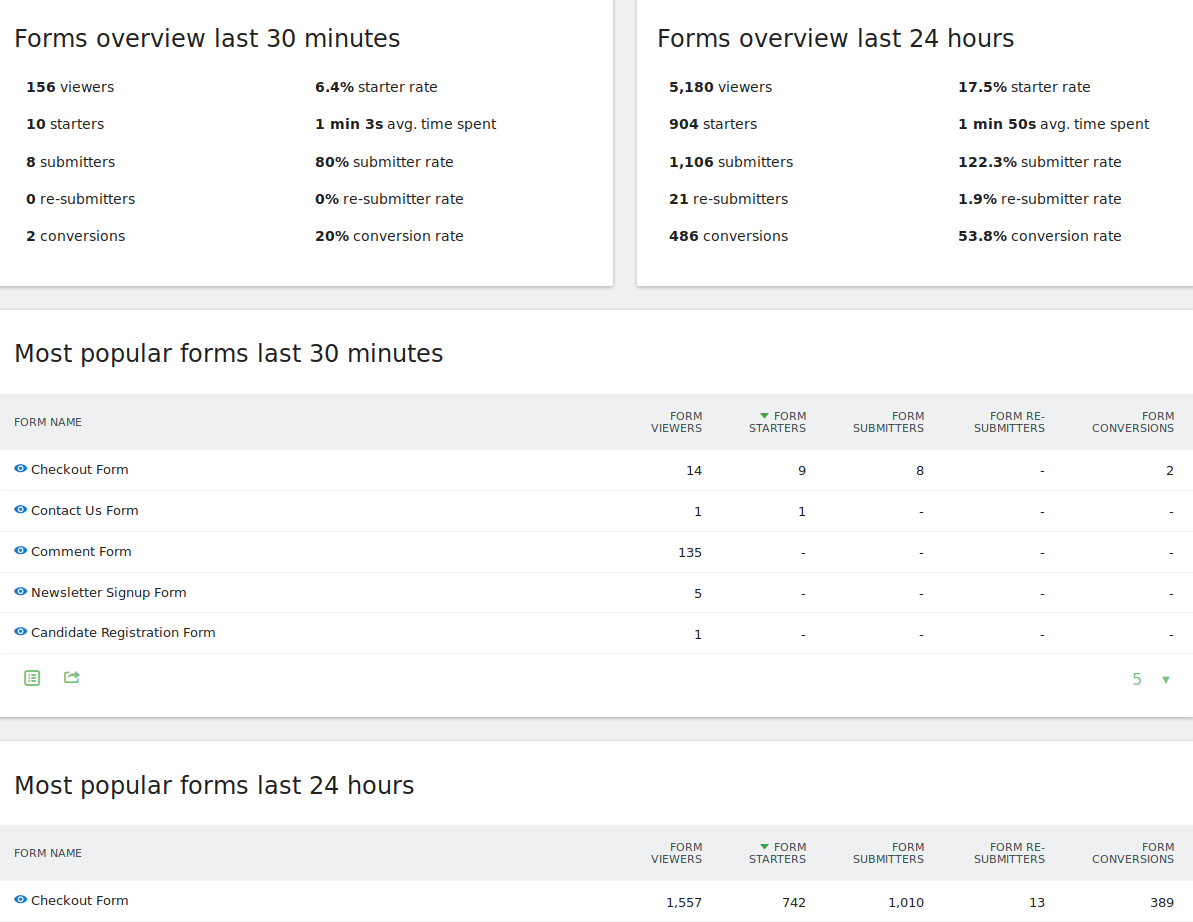
Real-time Reports
With the Real-time report you always have an eye on what is happening right now. It shows you how many form interactions there were in the last minutes, and the last hours. This is great to discover which forms perform best right now and lets you make quick decisions based on the current user behaviour for example after deploying an update of your website, after changing the forms, or after you changed some content.
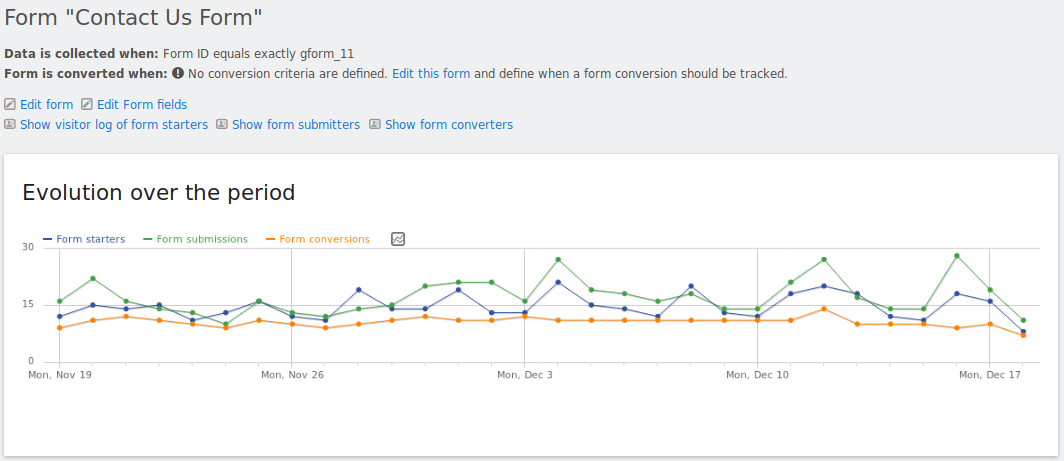
Form Reports
Matomo adds one menu item for each of your forms. Select any form to get all the detailed reports about this form. Each form page consists of different types of reports:
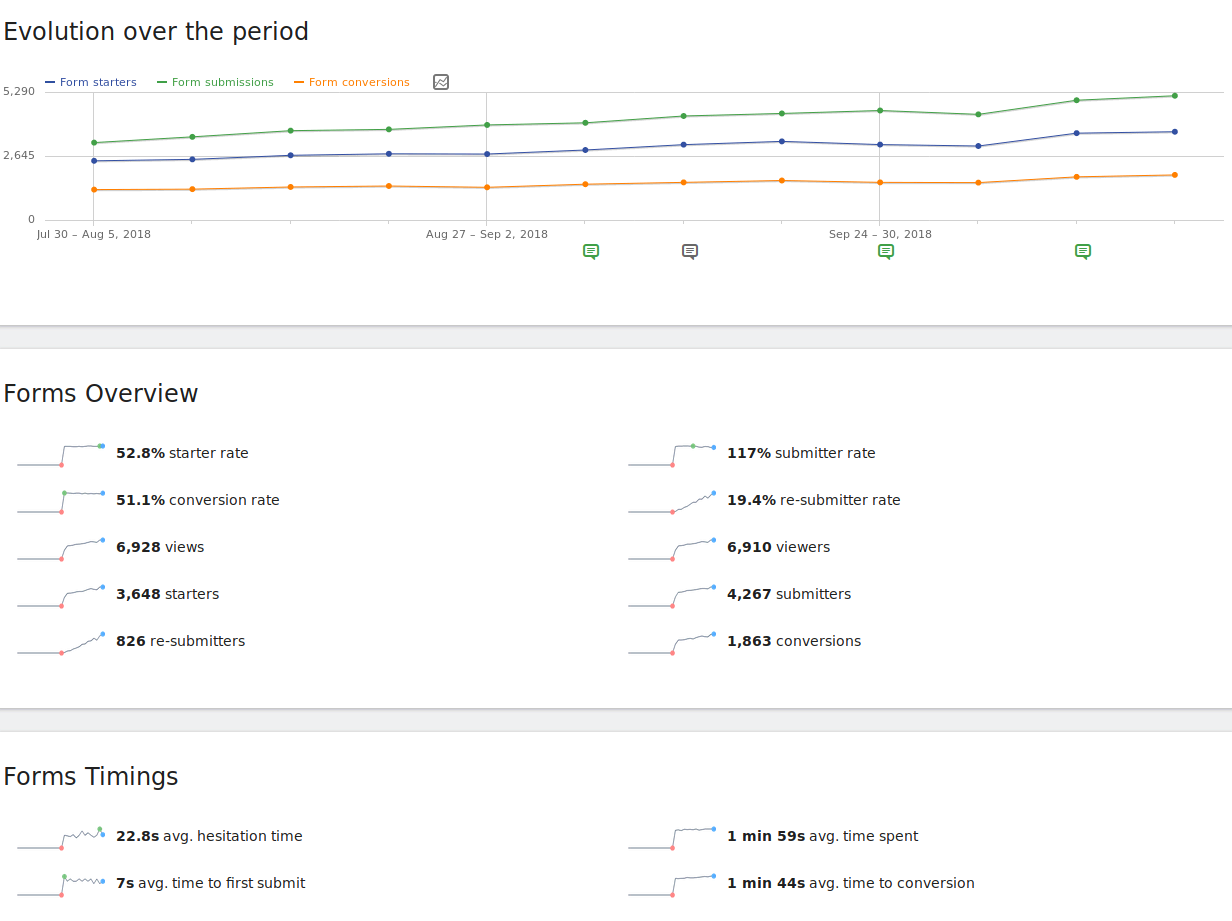
Form Summary
The form summary shows you information about the chosen form, the possibility to view the visitor log with all the visitors that have started, submitted or converted this form, and a table letting you see all the fields within that form. This way you get all the important information about the current form in case you don’t remember exactly where the form is located, what its purpose is, and how the form looks like.
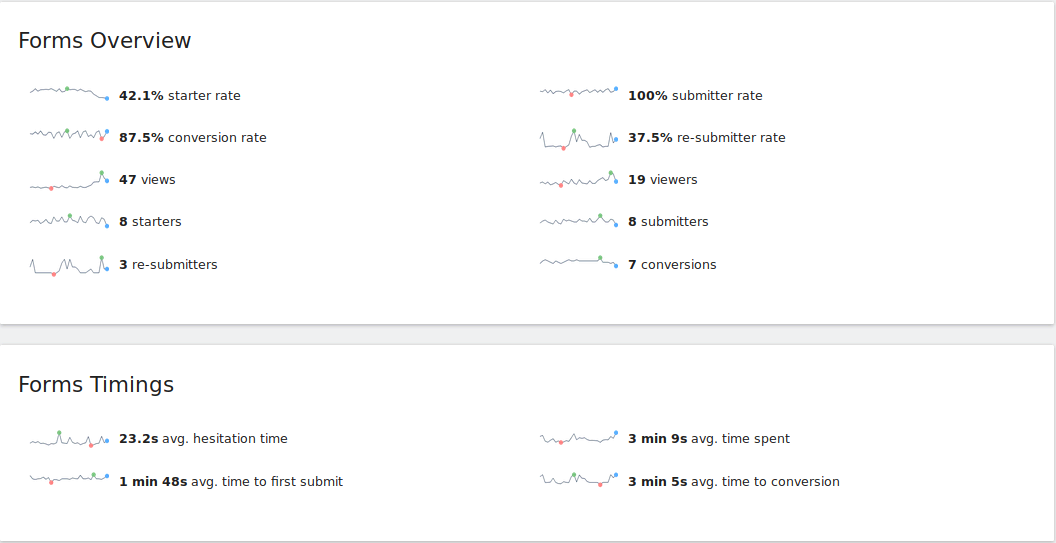
Below the summary you see an evolution graph and lots of sparklines showing you at a glance how important form metrics like the “Form conversion rate”, “Number of form viewers”, “Number of starters” and others perform over time. This helps you deciding on what to look and investigate next.
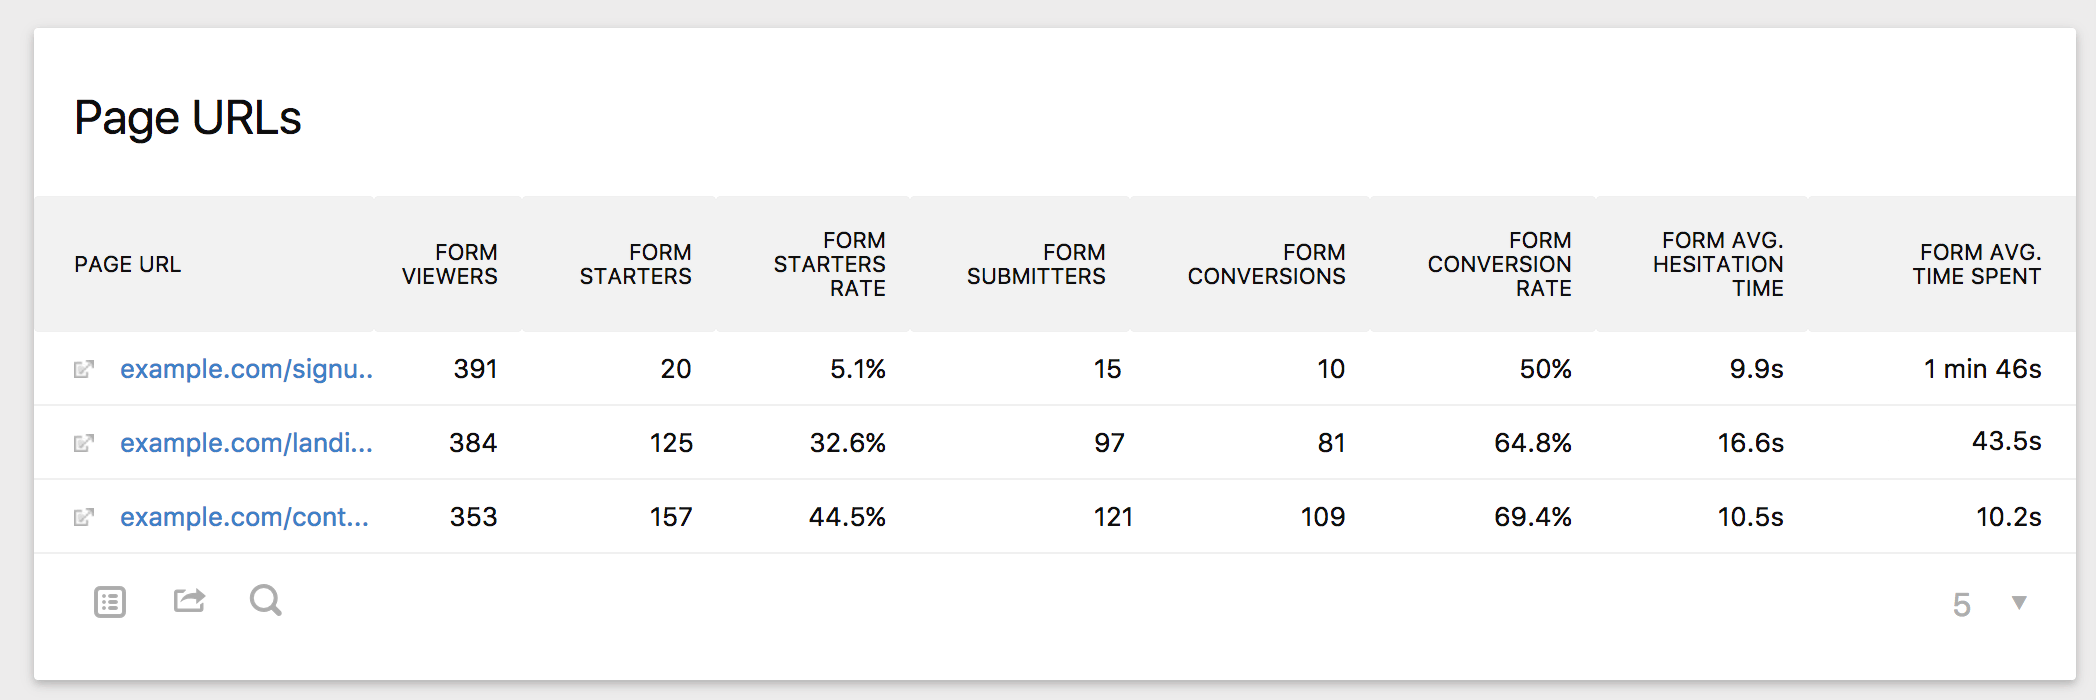
Page URL report
A Page URL report showing you all the important form metrics for each page where this form is embedded. This lets you see whether your users interact differently with the same form on different pages. This is for example also useful when you have different versions of the same form like in an A/B Test (experiment), or to see for example how your newsletter form performs on different pages.
The surroundings of a form can make a huge difference on the amount of how many users start filling out your forms. When you have the same form on multiple pages, you might notice that some headers, wordings, images, or backgrounds perform better than others. If one page outperforms other pages, you can find out why this is the case and possibly apply the same style or wording to the other pages as well to increase conversions.
Field reports
Form Analytics adds seven new reports to learn everything about how your users interact with your form fields. See which fields causes your users to stop filling out a form (drop offs), how they enter a form, how much time they spent on each field, how often they fill out and correct a field, which fields are unneeded, and much more.
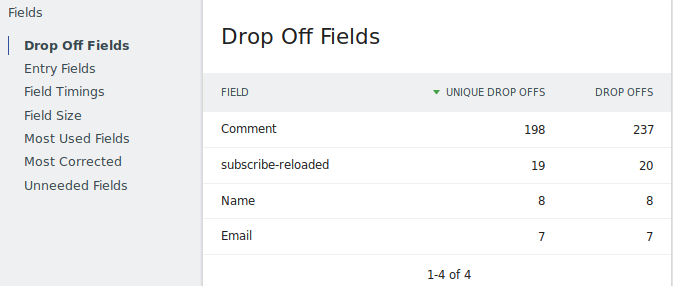
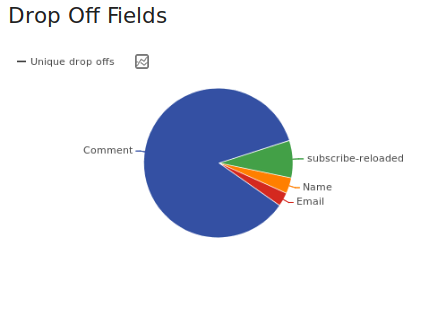
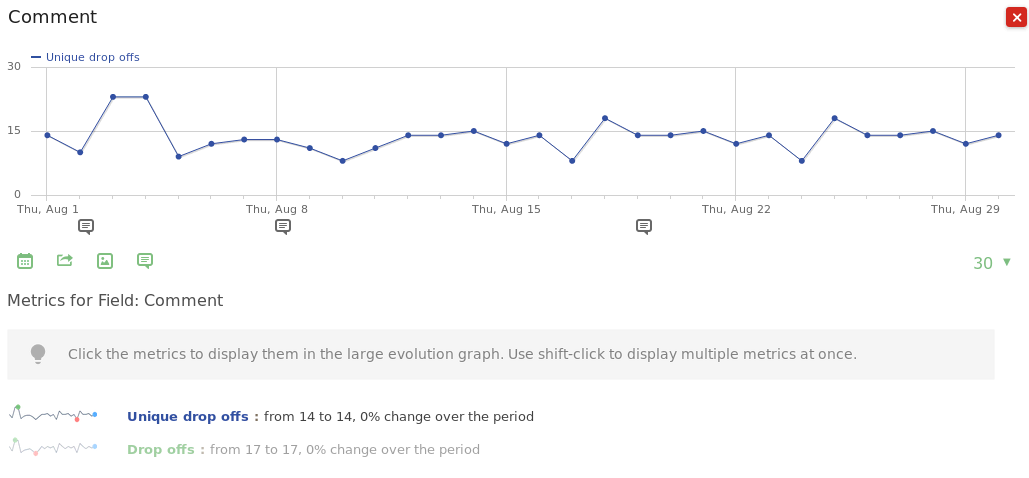
Drop Off Fields
The drop off report is critical to find out where you lose your visitors on a form. It shows which field a visitor focused on or interacted with last before abandoning the form. This can indicate why visitors did not submit the form, and where they stopped filling out the form or where they had problems. Focusing on improving fields with high drop off rates will directly result in an increase in form conversions.
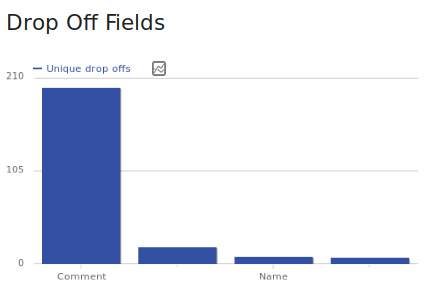
Different Visualisations
If you prefer a different visualisation, you can select in the bottom left corner of any report a different visualisation that shows for example many more metrics in the same table, or a bar or a pie chart instead of a table.
Row evolution
For any row within a table you can select the “Row evolution” icon to see how each row performs over time. This gives you ultimate insights into all your metrics as you can see at a glance whether your changes actually make things better or worse. Are you for example interested whether the drop offs for the form field “Firstname” improves or gets worse? Simple click on the row evolution icon and find your answer. This works with any report. You can for example find out if the time spent on a certain field actually improves over time, and much more.
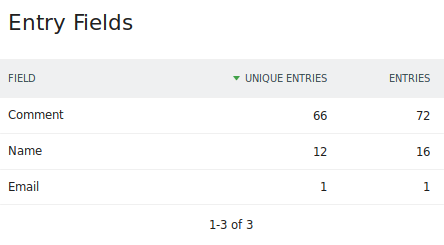
Entry fields
The entry fields report shows you with which fields your users interact with first when they start filling out a form. If many users do not start with the first form field in your form field, you may want to consider reorganizing the order of your form fields. This can lower the time your visitors need to fill out your form and increase the form starter rate which should be always one of your objectives. The more people start filling out your form, the more will complete it. Imagine the first field in a form is a field your visitors want to skip or find ambiguous, then they might not even consider to start filling out your form at all.
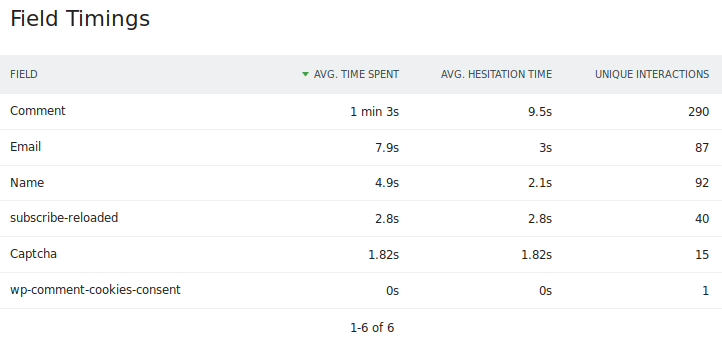
Field timings
Time is truly critical when it comes to filling out a form. In this report you find out which fields your visitors spend a lot of time on, and where they hesitate the most. The longer they need to fill out a field or the longer they hesitate, the more likely it is that they will abandon your form.
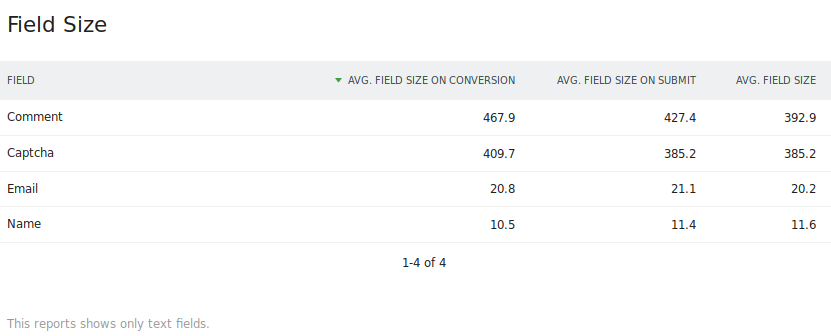
Field size
Do your visitors need to type a lot? This may reduce conversion rates as it results in too much effort for your visitors. Especially on mobile your visitors shouldn’t have to type much.
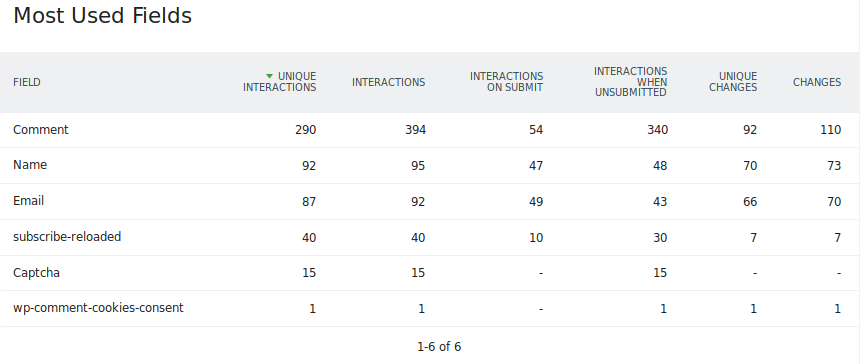
Most used fields
Find out which fields are used the most or the least. For example, you may want to re-structure your form based on this data and list most used fields first, and less used fields further down. It also indicates whether some fields may be rather unneeded and could be removed.
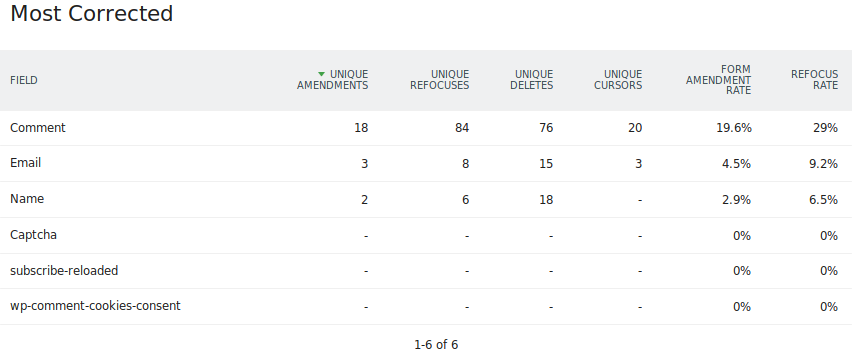
Most corrected
Discover where your visitors have the most problems filling out your form and causes frustration. Maybe different form fields are more suitable? Maybe you can pre-fill some values? Maybe the validation is too strict? Improving correction rates will directly lead to higher conversion rates.
The report shows about 20 metrics about amendments, re-focuses, deletes (backspace), and cursor movements, and much more. As usual, when you hover a metric, you will get a tooltip that explains what the metric means and how the data is collected. Lowering the corrections will directly result in higher conversion rates.
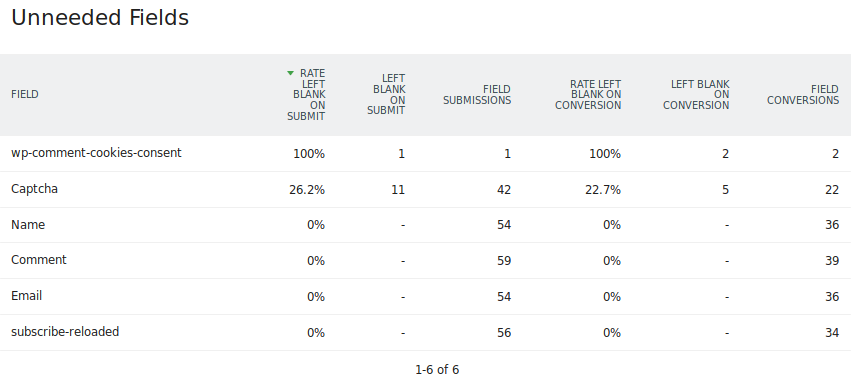
Unneeded fields
Fields that are often left blank can likely be removed which in turn will improve your conversions. Less form fields will increase the form starter and form conversion rates as your visitors will need to put less effort into filling it out. Your users might leave some fields blank because they find them ambiguous or not relevant.
Using Custom Reports
Custom Reports complement Form Analytics by providing additional insights beyond standard Form Reports. It allows you to analyse form interactions alongside other key metrics, such as those found in the Goals Report but not included in Form Reports.
For example, while the Form Reports do not natively show conversions by Channel Type, a Custom Report can provide this breakdown.
- When you create a custom report, set the Channel Type as the Dimension.
- Add Form Conversions and other form metrics as needed.
- Save the report to view form conversions broken down by traffic source.
This report lets you analyse which traffic sources drive conversions without relying on Goals.
Applying Segments
Form Analytics lets you apply any Matomo segment to the form reports allowing you to dice your visitors or personas multiplying the value that you get out of Form Analytics. For example you may want to apply a segment and analyze the form interactions for visitors that have visited your website or mobile app for the first time vs. recurring visitors. Sometimes it may be interesting how visitors that converted a specific goal or purchased something, the possibilities are endless. I really recommend to take advantage of segments to understand your different target groups even better.
The plugin also adds a lot of new segments to your Matomo letting you segment any Matomo report by visitors that have interacted with your forms. For example you could go to the “Visitors => Devices” report and apply a form segment to see which devices were used the most when they interacted with your forms. You can also combine segments to see for example how often your goals were converted when a visitor spent more than 10 seconds on a form and has submitted your form at least 3 times.
Did you know? Form Analytics reports are shown in the Matomo Mobile app, work with Scheduled Reports and Custom Alerts.