Analyse crashes
The Matomo Crash Analytics feature collects information about crashes and unexpected errors that occur on your website or application. This gives teams visibility into stability issues that may directly or indirectly affect user experience, conversions, and revenue. By analysing this data, you can identify recurring problems, understand their impact, and prioritise fixes based on real usage rather than assumptions.
- Log in to Matomo and click on Crashes in the left menu and select any Crash Analytics report you want to analyse.
Overview
The Overview report gives you an overview of the crashes that have occurred on your site, including which crashes are new, which have disappeared, and which have reappeared within the currently selected period.
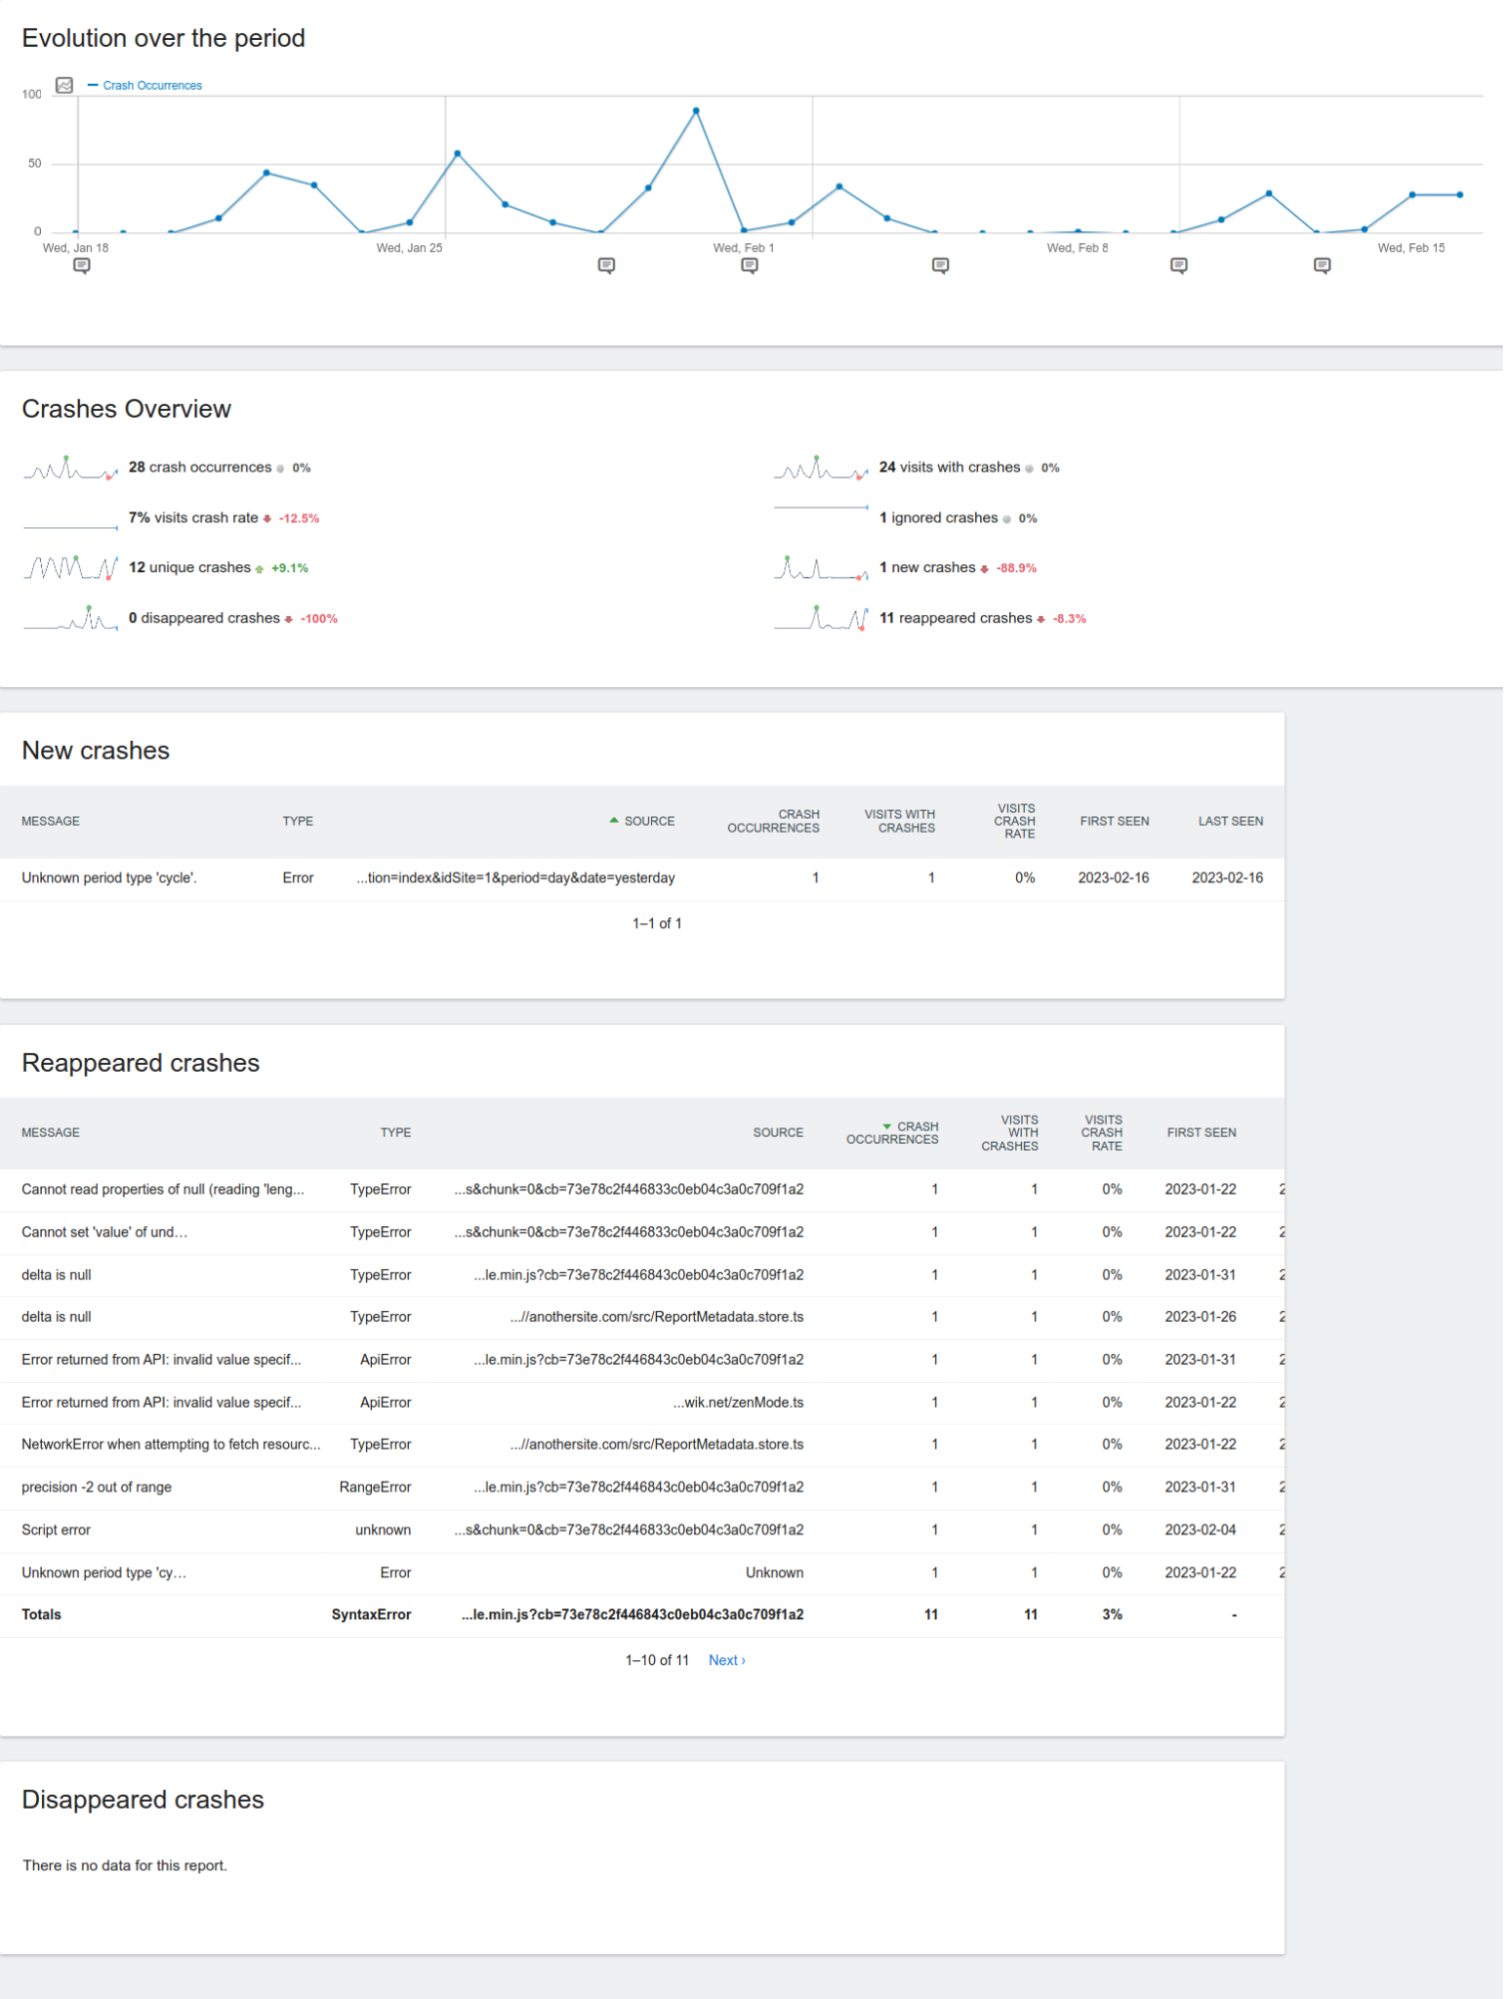
Tip: use annotations to mark important dates for your product or website so you can see crash trends in relation to release dates.
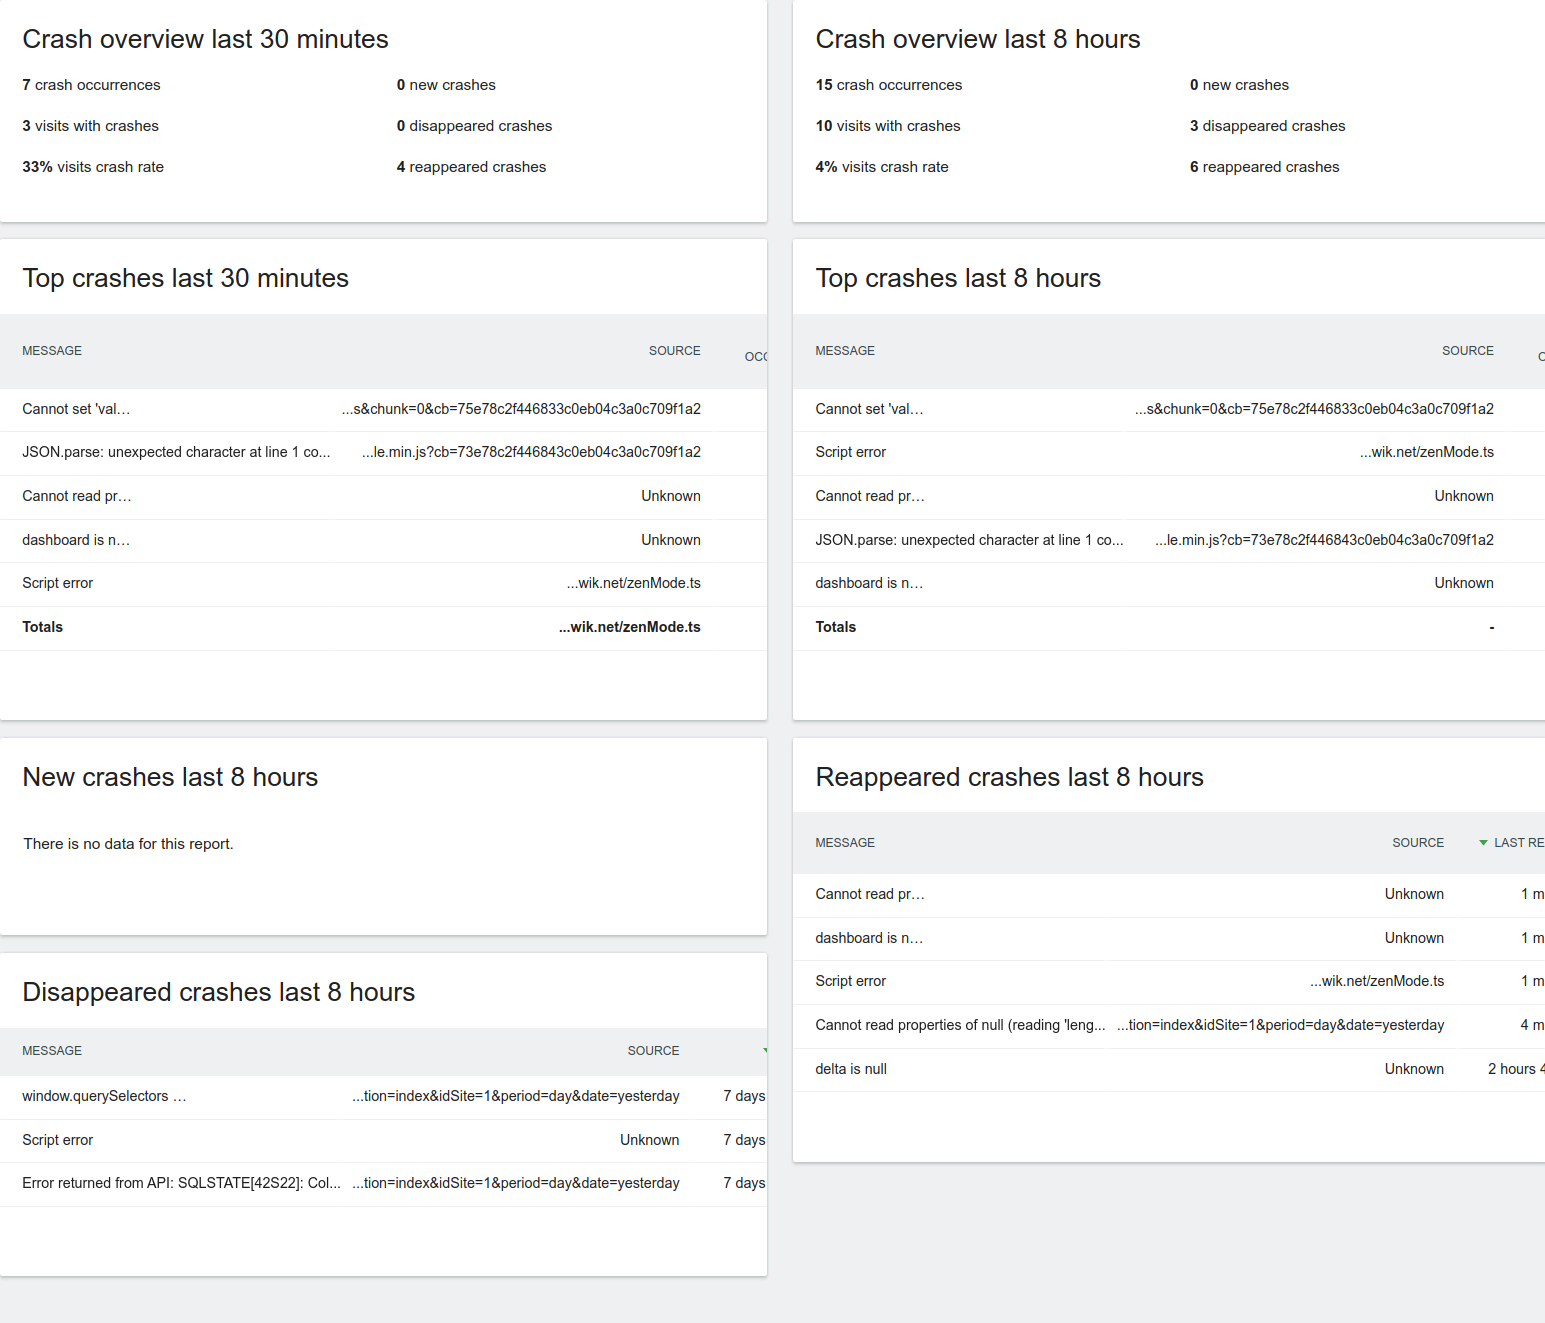
Real-time
With the Real-time report you can see what crashes your users are experiencing right now, allowing you to respond immediately if needed.
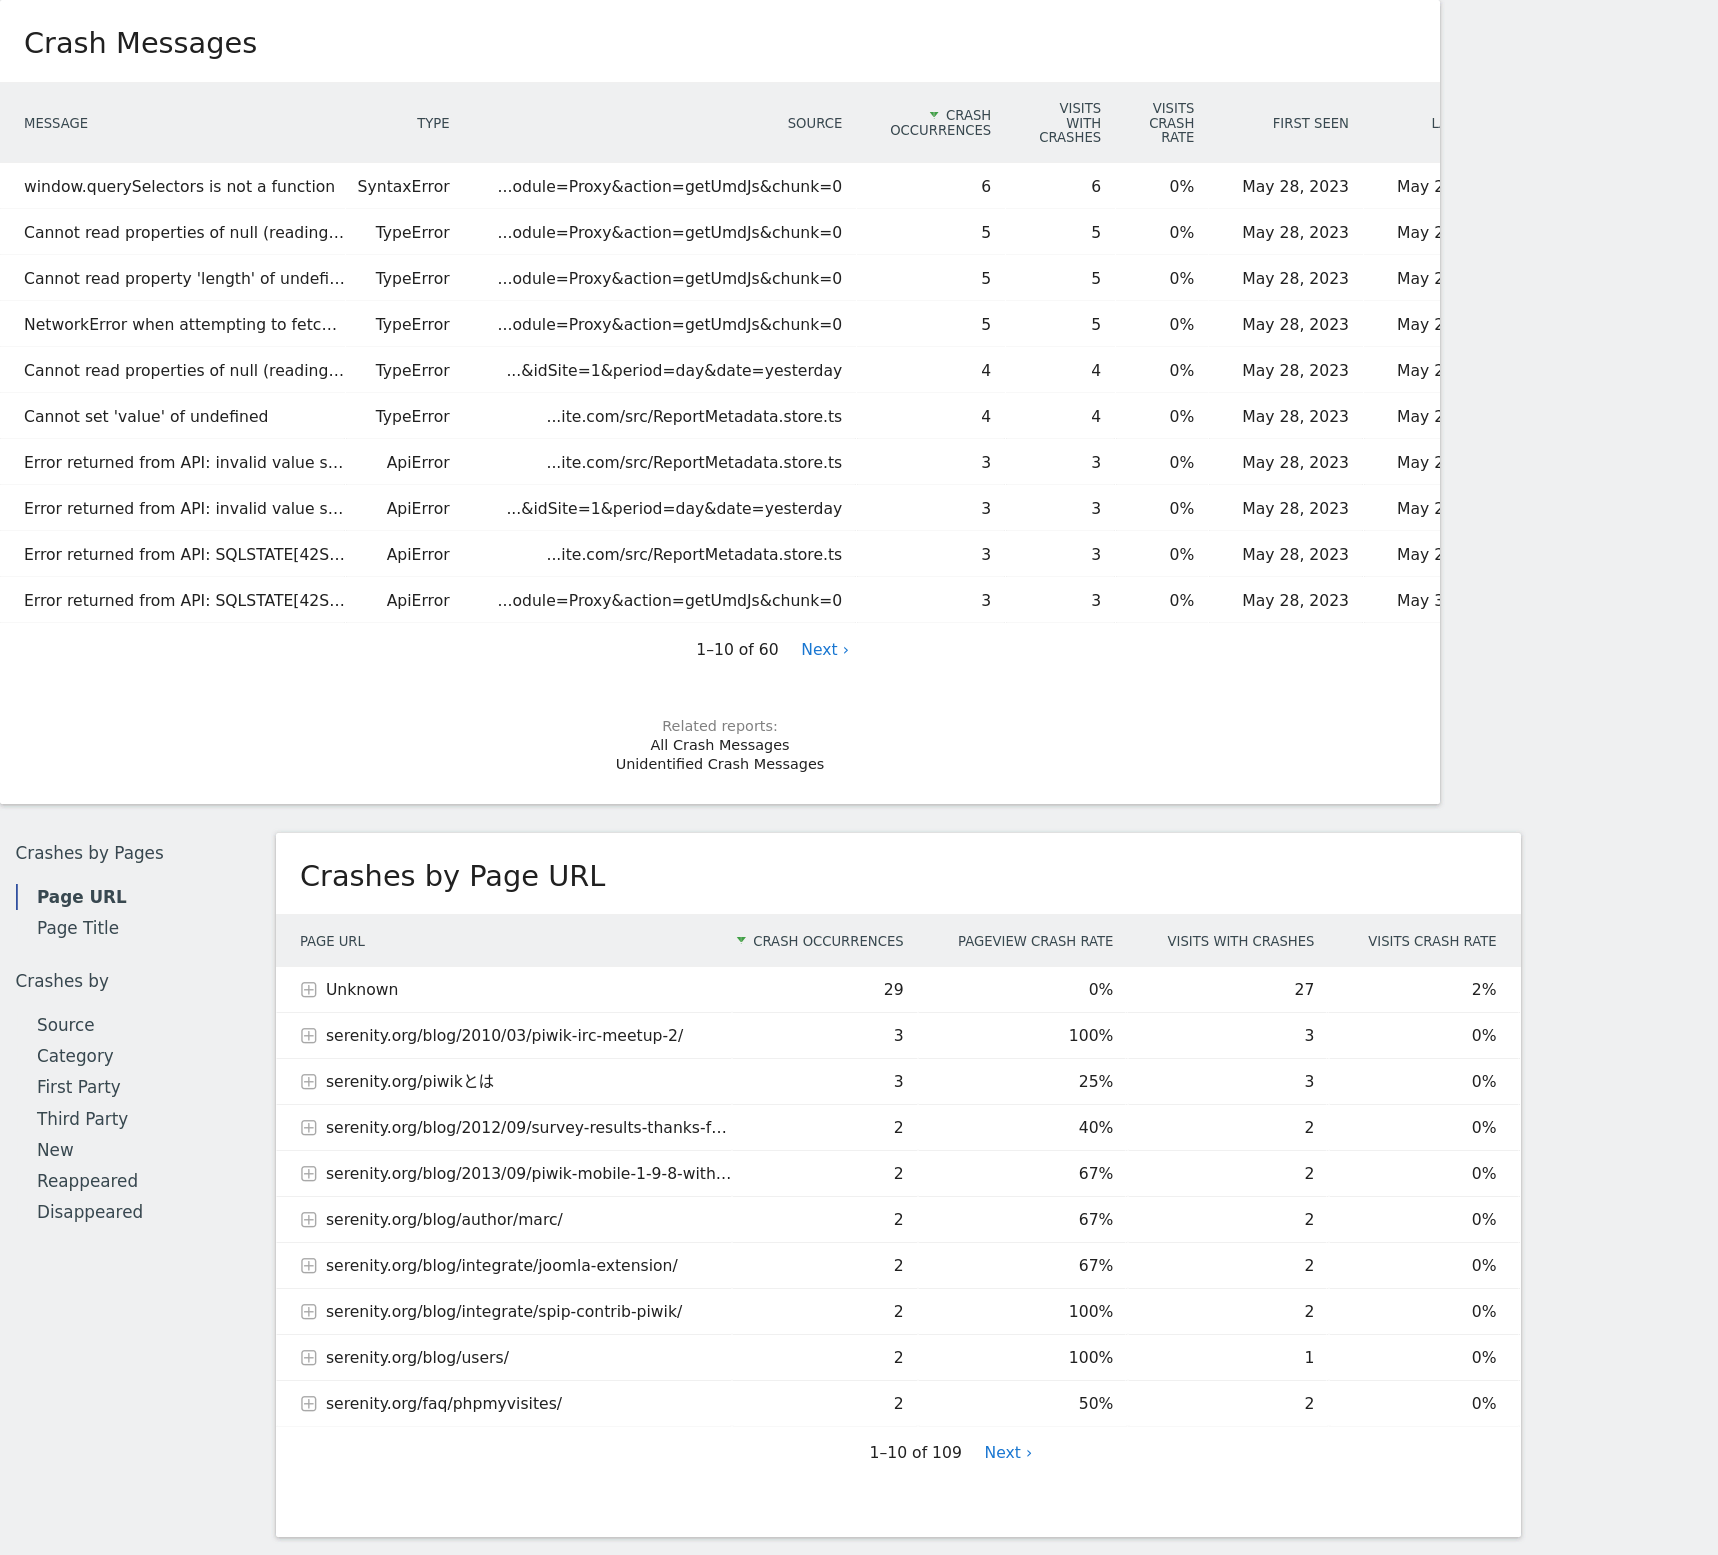
All Crashes
This report provides information about every crash that occurs within the currently selected period. This includes detailed information about every crash as well as crashes by different dimensions, like crashes by Page URL and crashes by originating Source File.
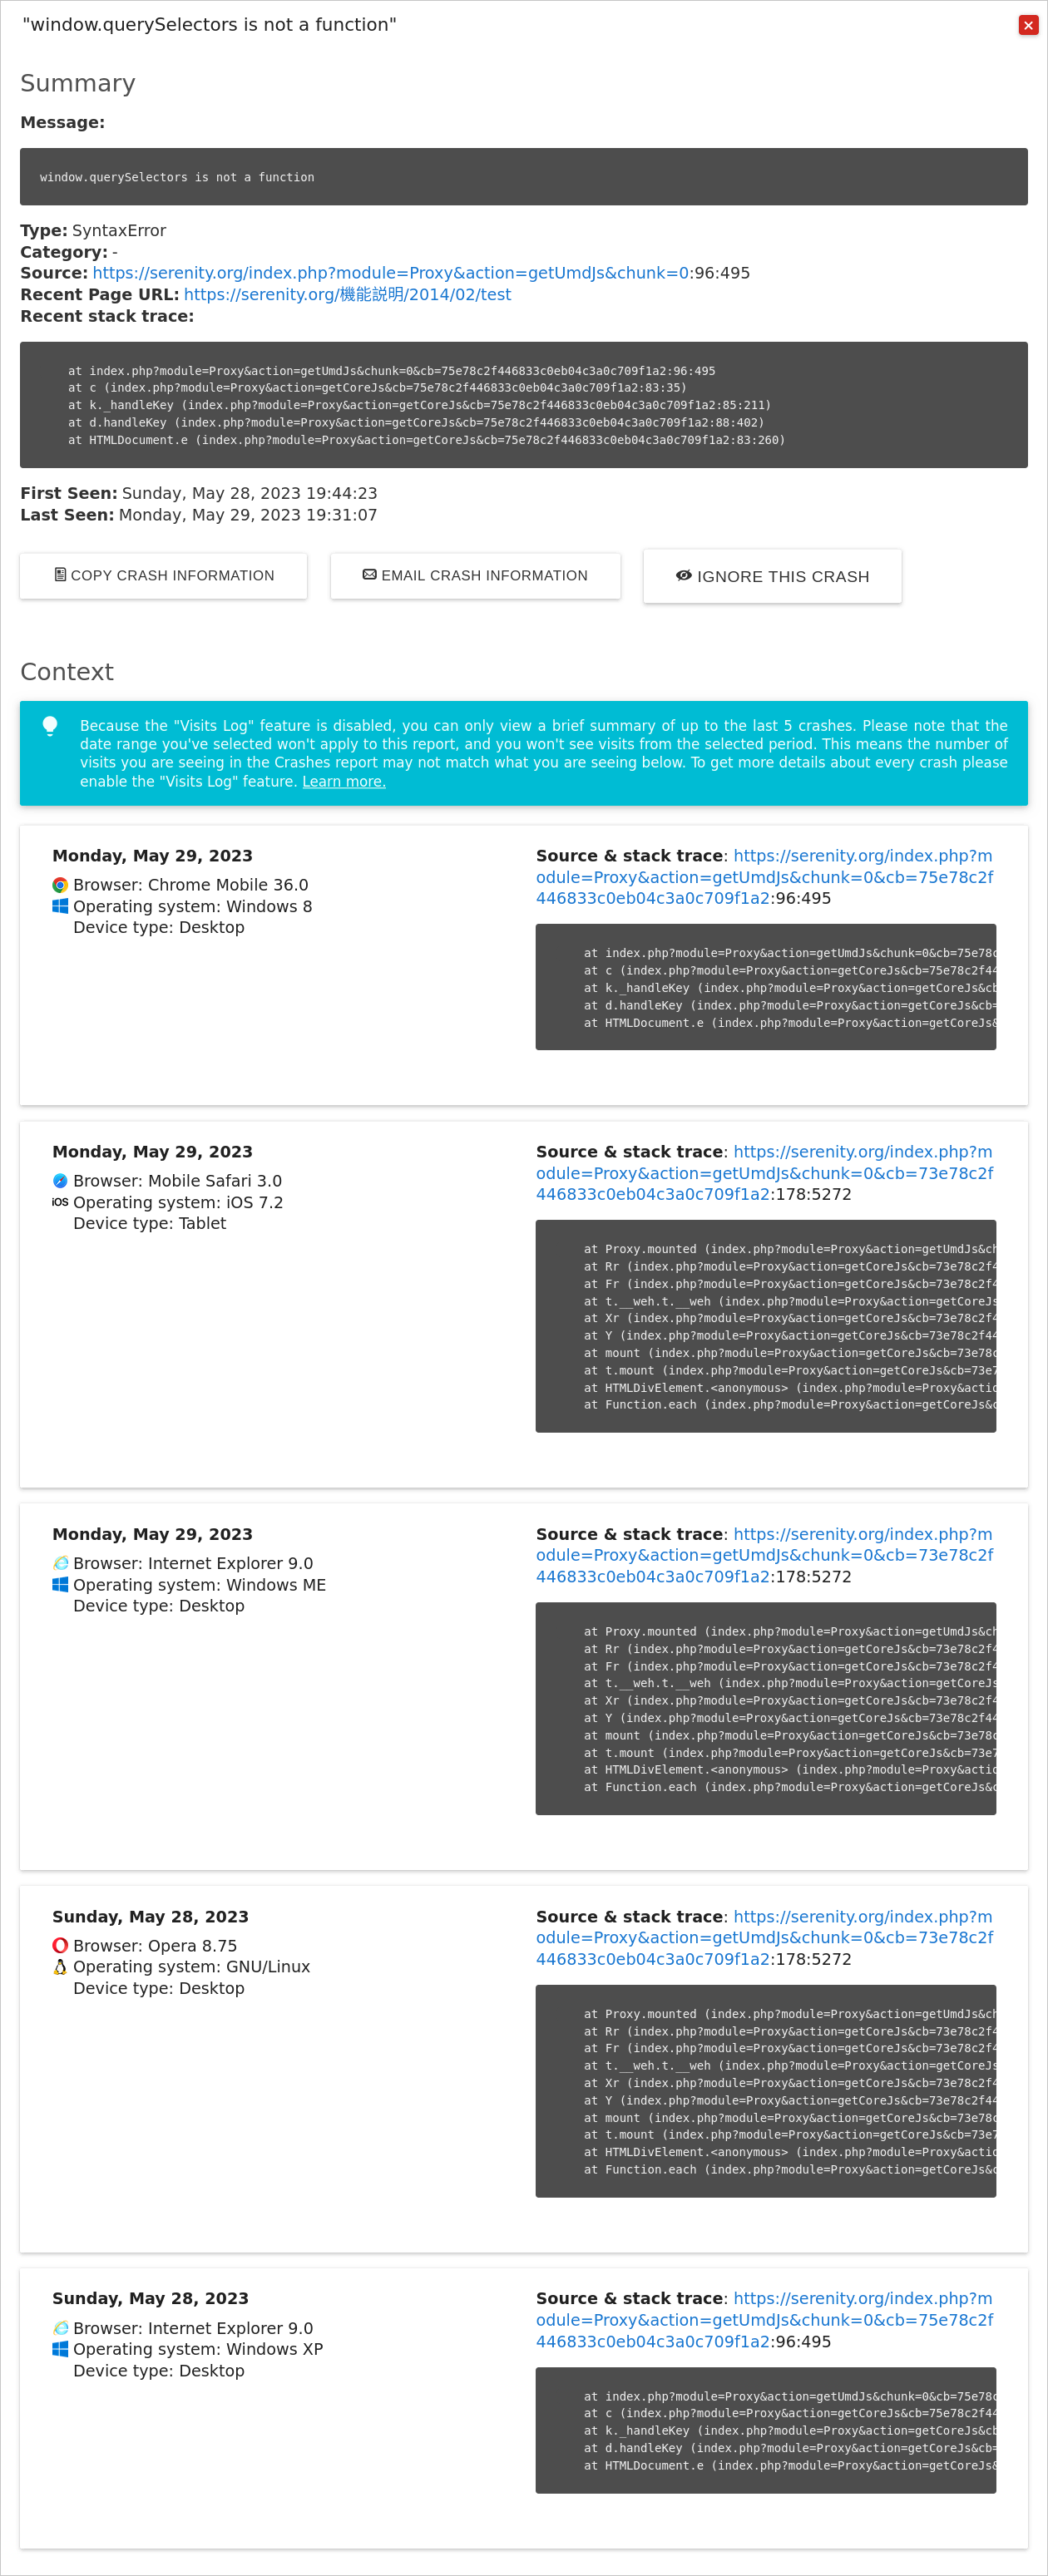
Inspecting Crash Details
On every report that displays crashes there’s a row action you can use to inspect the details of each crash:
![]()
Here you can find detailed information of a crash including a full stack trace and visits that experienced the crash.
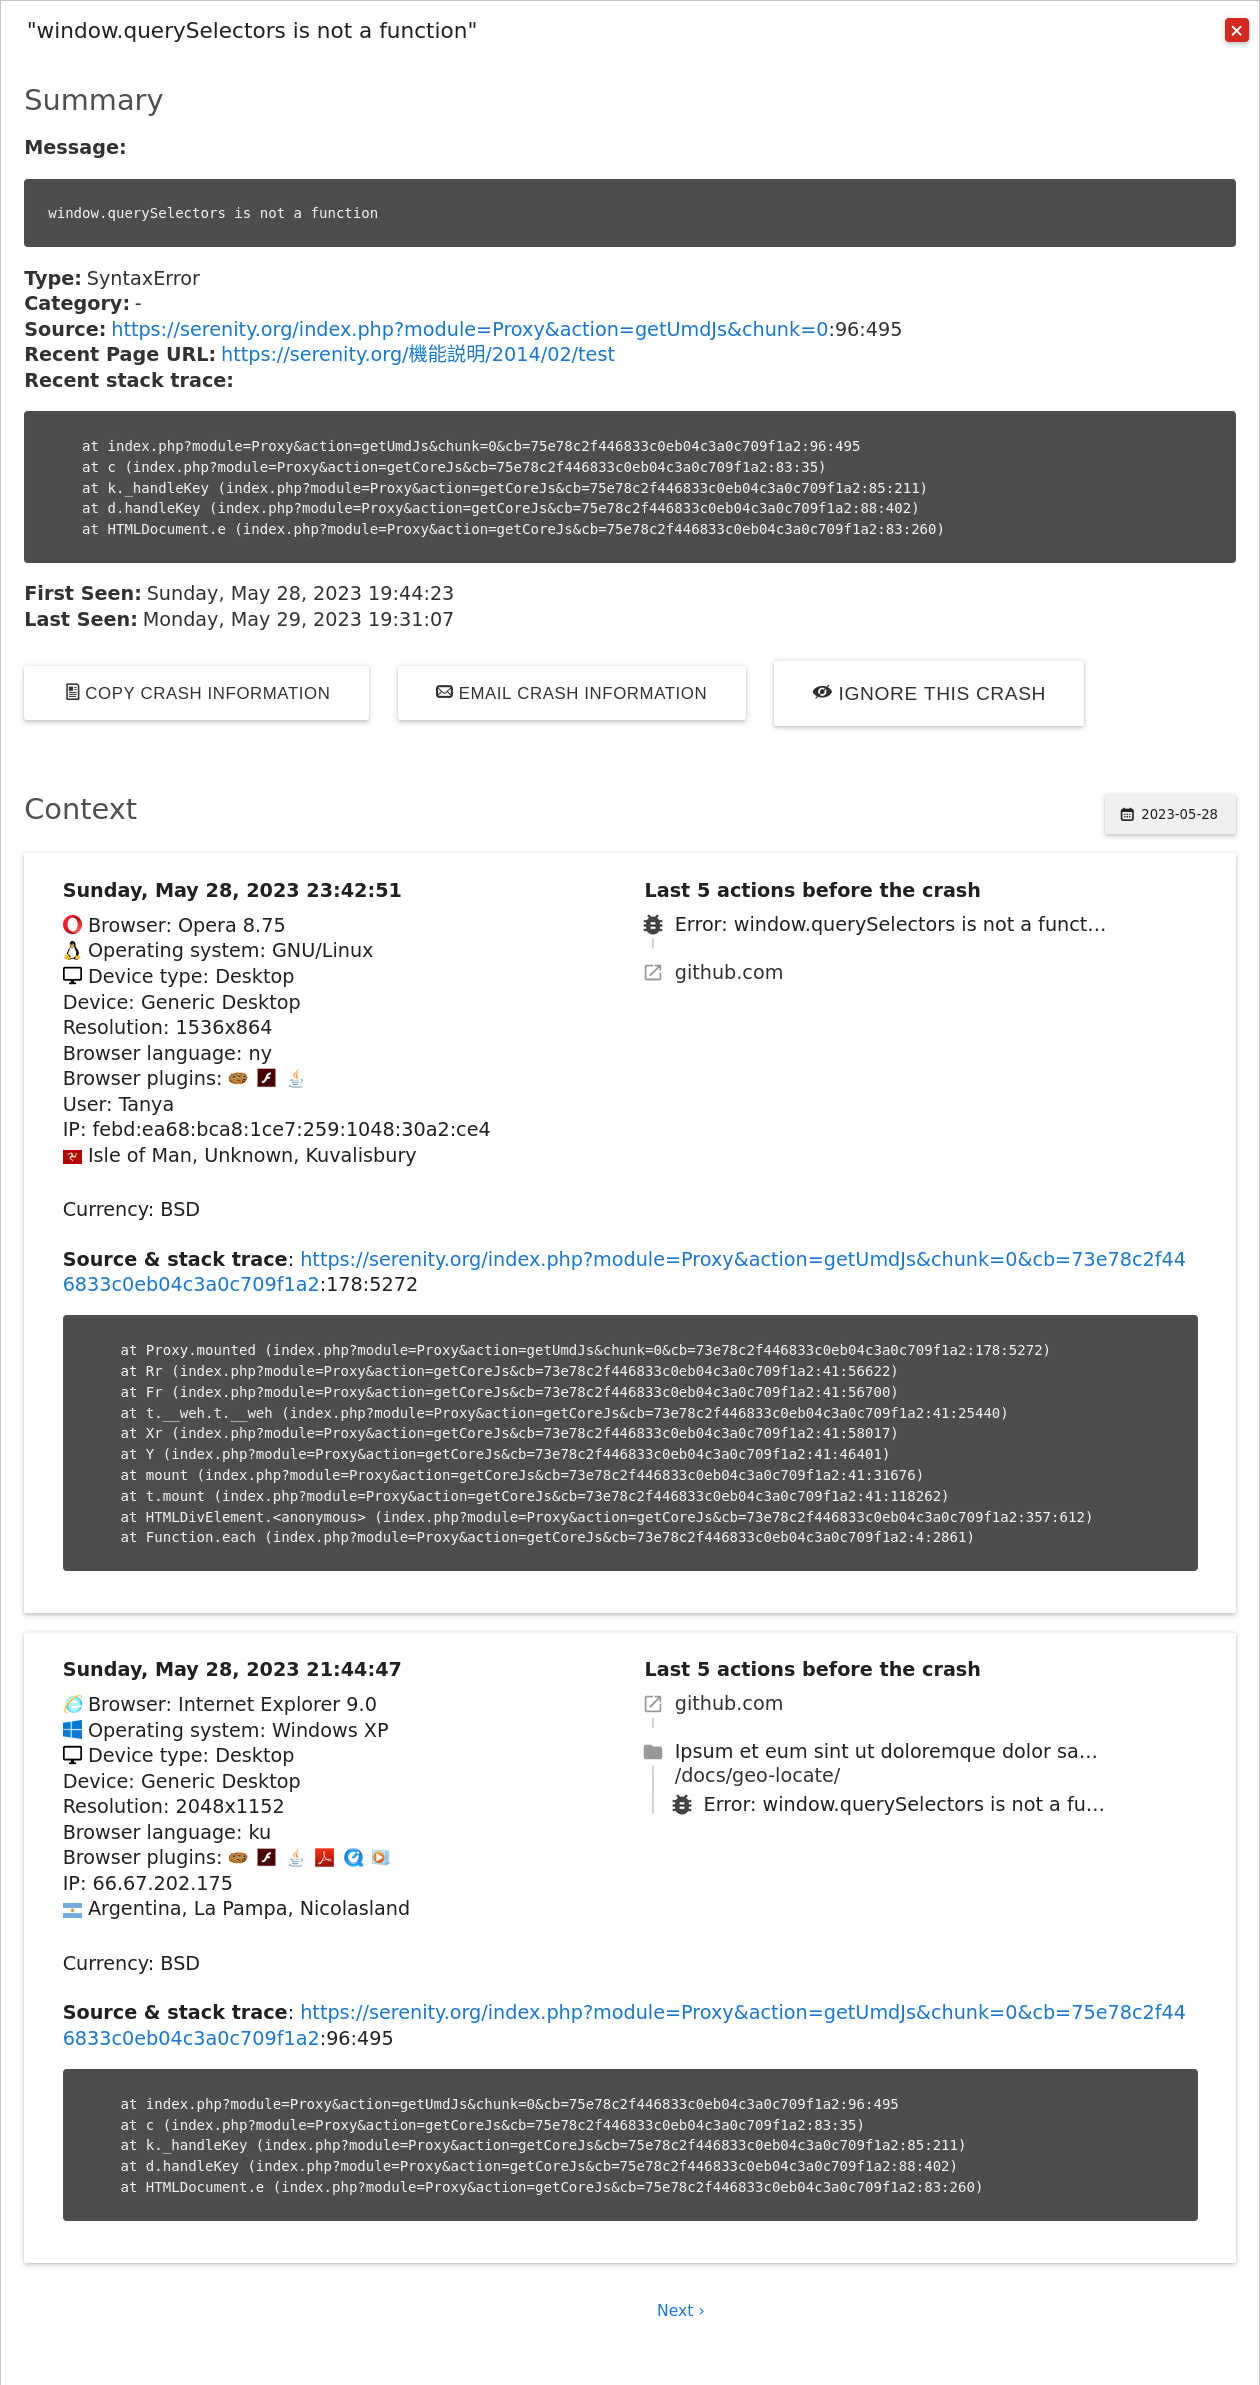
If a crash is not important to you, this is also where you can ignore it so it will no longer appear in your reports.
Note: If you have disabled the visits log, you will only see limited information for a couple of the most recent crash occurrences: