Analyse Heatmaps
Matomo Heatmaps provide a visual representation of visitor interactions on your web pages, giving insights into behaviours that can help optimise your website’s usability and content placement.
View Heatmaps
- To get started, log into Matomo and click Heatmaps in the left-side menu.
- Select the Click, Move, or Scroll report.
- Choose the Device Type and Width of the specific device and screen size to view how interactions may differ between desktop, tablet, or mobile users.
Not seeing any heatmap? Create a heatmap first.
Heatmap Legend
Heatmaps use a colour gradient to represent visitor interactions. The colours indicate the intensity of engagement, with warmer colours showing areas of high activity and cooler colours showing areas with less interaction.
- Red / Dark Orange: High interaction areas where users click or move their mouse frequently.
- Yellow / Light Orange: Moderate interaction areas with some user activity.
- Green: Low interaction areas where only a few users engage.
- Blue / Transparent: Minimal or no interaction recorded in these areas.
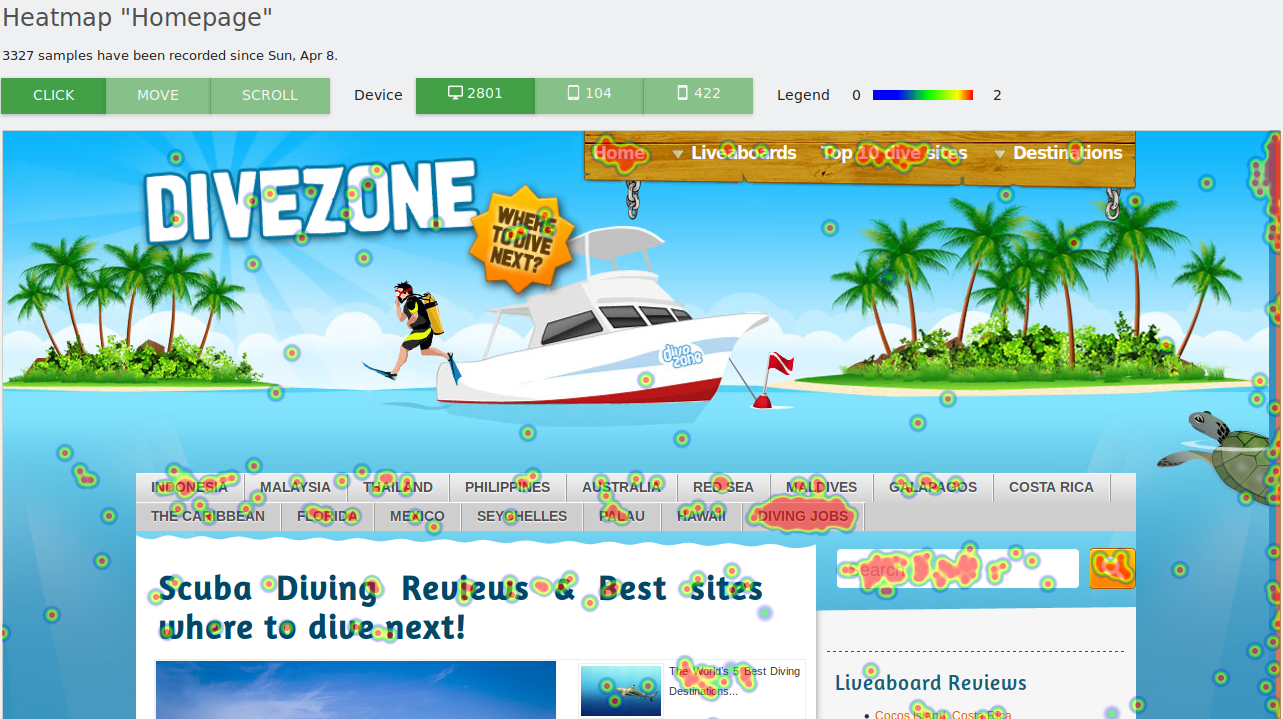
Click Heatmap
The Click Heatmap visually highlights where visitors click on your webpage. These clicks are shown as coloured thermal spots, with the size and colour intensity varying according to the frequency of click on each specific area.
This report helps you understand user navigation patterns, pinpoint popular or ignored elements, and uncover areas that your visitors mistakenly perceive to be clickable. Hover over any area or element to view the metrics:
- Click Rate: The total number of single clicks on the underlying element of the page.
- Click Rate Percentage: This metric shows the share of total page clicks that a specific element receives.
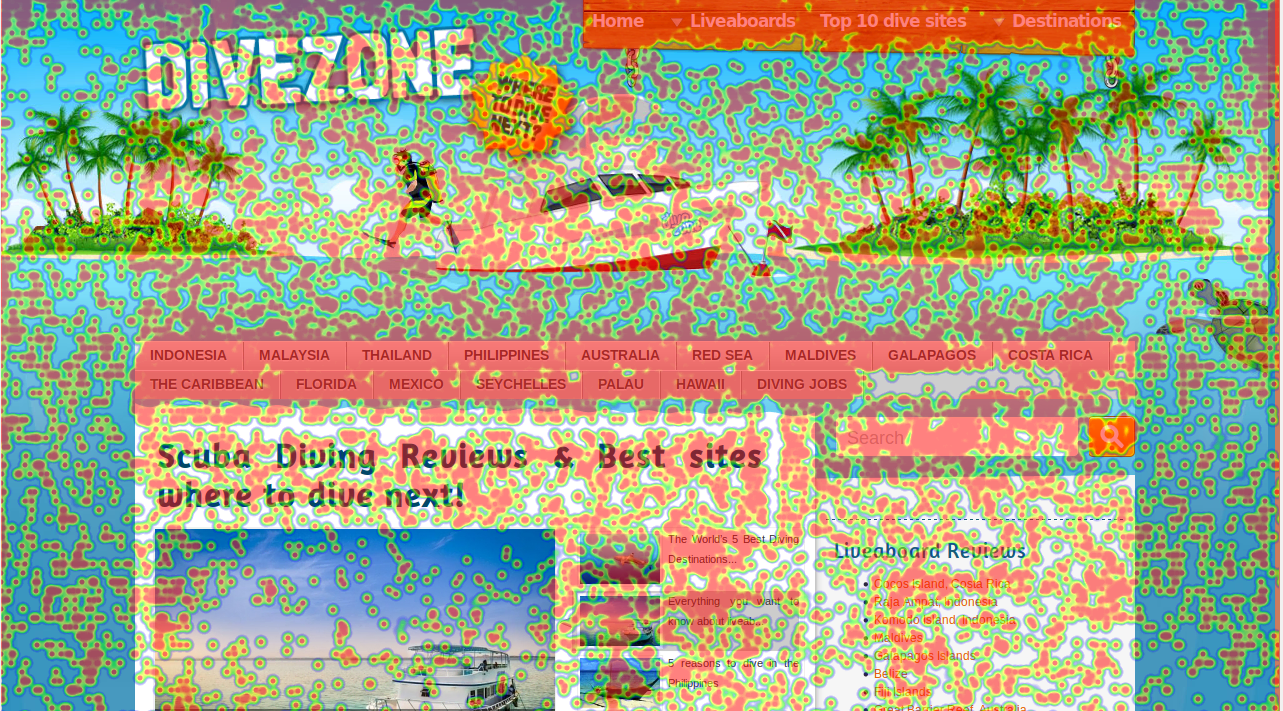
Mouse Move / Hover Heatmap
A mouse move heatmaps is similar to eye tracking but requires only seconds to set up and you can see results much faster. This type of heatmap captures the areas where visitors move and hover their mouse or touch the screen.
It highlights user engagement patterns, showing the parts of the page that attract the most attention and which parts are ignored. Hover over any area or element to view the metrics:
- Number of Moves: The total count of cursor movements captured within a specific area.
- Move Rate Percentage: The percentage of total page movements that occur in that region, providing insight into how users navigate and focus their attention.
Scroll Heatmap
Scroll Heatmaps use colour gradients to visualise how far down a page your visitors scroll. When you hover on the Scroll heatmap, you see exactly how many percent have scrolled down to a certain position.
This lets you for example find out if there is important content positioned too far down the page, whether your visitors are encouraged to scroll, and more. Hover over any area or element to view the metric:
- Percentage of Visitors Who Reach This Point: The proportion of users who scroll to a certain level of the page, highlighting potential issues with content placement or user engagement.

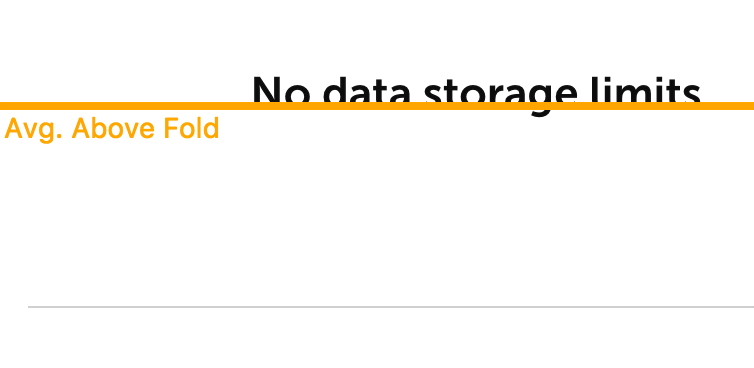
Above the fold
“Above the fold” is the content that a visitor sees without scrolling. The “Average Above the Fold” line will show you how much content your visitors see on average when they open your page. Use this information for example to find out if you need to show key content further up.
Applying segments
You can apply any of the over 100 Matomo segments and view the engagement for different target groups.
Applying date range
In Heatmaps, date range is disabled by default. But it can easily be enabled. In your browser, date selection becomes enabled as soon as you append &useDateUrl=1 to the end of your heatmap browsing URL.
Disabled:
https://yoursitenamegoeshere.matomo.cloud/index.php?...&category=HeatmapSessionRecording_Heatmaps&subcategory=11
Enabled:
https://yoursitenamegoeshere.matomo.cloud/index.php?...&category=HeatmapSessionRecording_Heatmaps&subcategory=11&useDateUrl=1
Devices
The Heatmap report lets you view the engagement for desktop, tablet and mobile devices with just one click.