How to import Matomo data into Tableau
Tableau provides several products for analysing and sharing dashboards, Tableau Desktop, Tableau Server, Tableau Cloud, and Tableau Public. These tools enable advanced visualisations where Matomo data can be combined with other business systems to create tailored dashboards.
This guide explains how to connect Matomo Cloud or On-Premise data to Tableau and build shareable visualisations:
- Connect Matomo data to Tableau
- Create the data source in Tableau
- Build the visualisation with Matomo data
- Publish and share your dashboard
1. Connect Matomo data to Tableau
Before connecting Matomo to Tableau, identify where your analytics data is stored and how it will be accessed.
Tableau does not connect directly to the Matomo Reporting API and only uses structured data sources such as files, databases, and data warehouses. Choose the integration method that best fits with your Matomo deployment and infrastructure.
File-based imports (Cloud and On-Premise)
This is a basic file-based approach that works with both Matomo Cloud and On-Premise, but it does not provide live real-time updates. For automated workflows, use the export URL with the token_auth to retrieve updated CSV files and store them in a shared location that Tableau can refresh.
Connect Tableau directly to the database (On-Premise)
Matomo On-Premise allows direct access to the application database. Connect to your database using a supported connector in Tableau, such as MySQL or MariaDB.
Connect Tableau to a data warehouse platform (Cloud)
The Matomo Data Warehouse Connector (DWC) enables the export of your Matomo Cloud data to a supported data warehouse platform, such as Google BigQuery or Snowflake. Using the native connectors in Tableau, you can then connect directly to the warehouse. Learn more about how to enable the Data Warehouse Connector.
2. Create the data source in Tableau
After exporting your Matomo data or preparing your database or warehouse connection, create a data source in Tableau. The steps differ depending on whether you use Tableau Cloud or Tableau Desktop.
Tableau Cloud
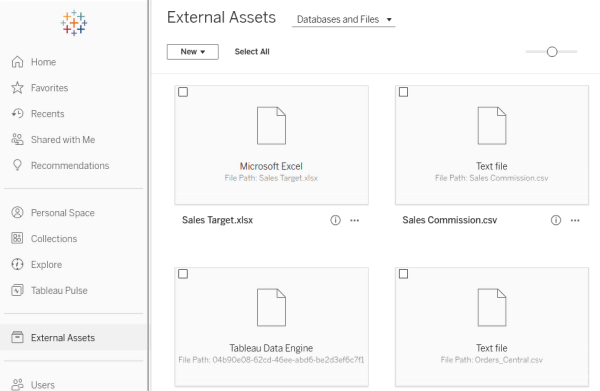
- Open Tableau Cloud and navigate to External Assets.
-
Click New > Workbook.
-
On the Connect to Data page, open the Files tab to upload the CSV file.

- To connect to a database source, open the Connectors tab, select the connector and provide the login credentials to set it up.
- Tableau creates a new data source and opens the Workbook editor automatically.
- You can now begin building your visualisation.
Tableau Desktop
- In Tableau Desktop, navigate to the Connect menu.
-
For file-based imports, open To a File > More… and upload the exported Matomo CSV file.

-
If connecting to a database, open To a server and click the required server option.
3. Build the visualisation with Matomo data
After creating the data source in Tableau, you can now start building the visualisation in your Workbook editor.
In the following example, the Visits Summary report was exported from Matomo in CSV format and uploaded to Tableau as a data source. The dataset includes fields such as date, nb_visits, nb_actions, and nb_actions_per_visit that can be used to build charts.
Create an extract
- In Tableau Workbooks, the Data Source tab defines the connection configuration where multiple data sources can be added to the same workbook. The fields from each source then become available, allowing you to combine data from different reports or external systems in a single visualisation.
- You can also create an extract (snapshot) of your data stored in Tableau’s optimised format. This allows scheduled refreshes to be configured in Tableau Cloud or Tableau Server after publishing.
-
Open the Workbook > Data Source tab and select Extract instead of Live.
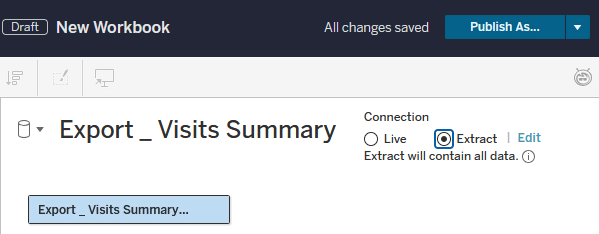
-
Click Edit to configure the settings for refreshing data. Tableau generates a
.hyperextract file and uses it for analysis instead of querying the original source each time.
Create the visualisation
- In the new Workbook, open Sheet 1.
- Drag
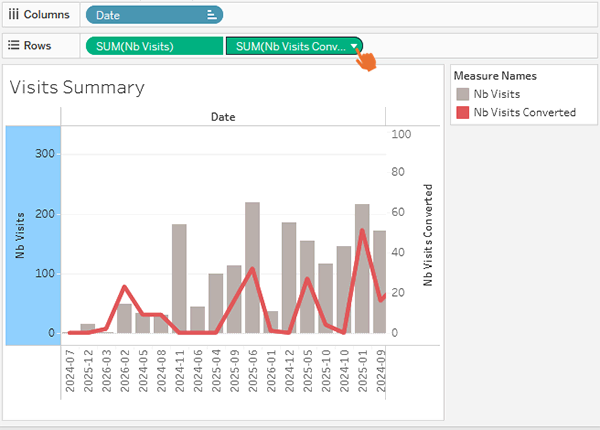
dateto Columns. Set the day to Continuous – recommended for time-series analysis. - Drag
nb_visitsto Rows. Tableau automatically treatsnb_visitsas a measure. - Set the Marks type to your preferred chart format. For example, use a line chart showing daily visits over the selected period.
Set the Marks type to your preferred chart format. For example, use a line chart showing daily visits over the selected period.

Click to expand the worksheet example

Tableau Worksheets
By default, when you drag a second measure to Rows, Tableau creates a second axis. This appears as a separate pane with charts stacked vertically on one worksheet published as a single view. You can customise your visualisation using different techniques, for example:
Dual axis (single combined chart)
Create one combined chart with two measures.
1. Add two different measures to Rows.
2. Expand one of measure’s drop-down settings and select Dual Axis.
Dashboard with separate worksheets
Create multiple worksheets, for example, one for visits and another for engagement.
- In the worksheet view, click on Dashboard > New Dashboard.
- Drag-and-drop the required sheets on the editor and customise as needed.

4. Publish and share the Tableau visualisation
You can publish an individual worksheet or a dashboard using the same steps. If you created the visualisation directly in Tableau Cloud, it is already saved within your selected project and ready to share.
When using Tableau Desktop, the visualisation must be published to Tableau Cloud before sharing.
Tableau Cloud
- Open Explore and select the report.
- Open the Actions drop-down and click Share.

- Enter the users who have view access.
- Copy and share the link with others.
Tableau Desktop
- Open your workbook in Tableau Desktop.
- Navigate to Server > Publish Workbook and enter your Tableau Cloud credentials.
- Once signed in, click Server > Publish Workbook and choose the destination project.
- Review the data source settings and click Publish.
After publishing, Tableau opens the workbook in Tableau Cloud. You can then manage permissions, share links, and configure refresh schedules.
Next steps
After connecting Matomo data to Tableau and publishing your visualisation, you can add filters, calculated fields, combine Matomo data with other business data sources, and create advanced dashboards.
Refer to the official Tableau documentation for additional information about publishing options and data source management.