Analyse Cohorts
Cohorts is a premium feature which is included in our Cloud-hosted Business plan or you can purchase it on the Matomo Marketplace if you self host Matomo On-Premise.
Viewing the Cohorts Report
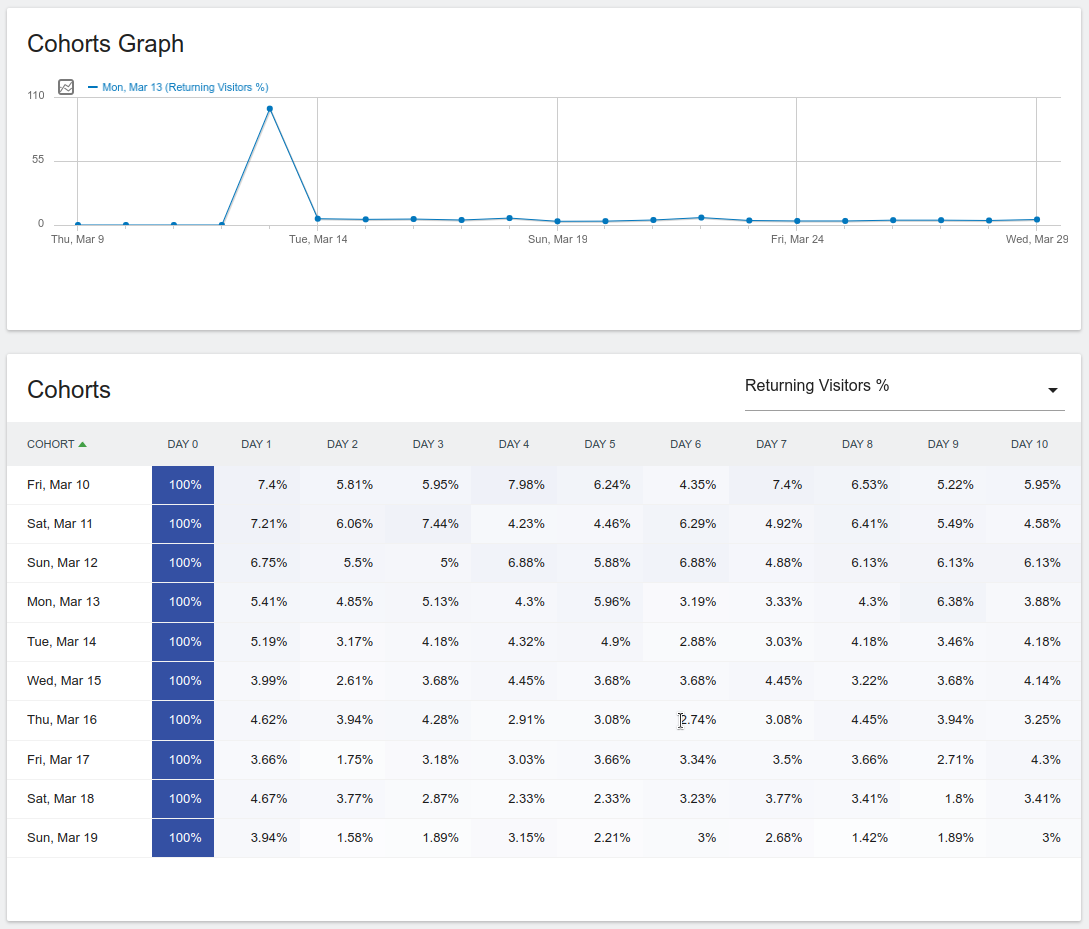
Go to Matomo. In the left menu click Visitors > Cohorts. The Cohorts reports will be displayed based on the currently selected period:
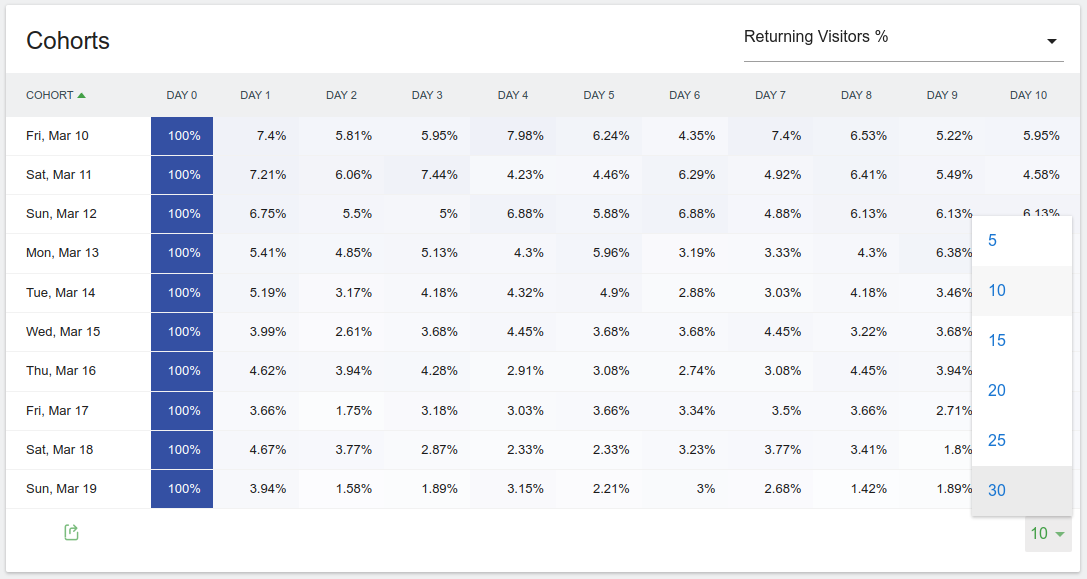
The range of cohorts displayed will be the last N cohorts for the currently selected period. You can change this number by using the limit selector in the Cohorts report:
Both the graph and the table show the same information, just in different ways. While the graph is just a standard
time series, the cohorts table will show how cohorts behave over time.
Each row in the table represents a cohort, and each column is a period after the cohort initially appears. For example, in the above images, ‘Day 0’ is the day the cohort appears, ‘Day 1’ is the day after, ‘Day 2’ is the day after the day after, etc.
The metric displayed in the report can be configured via the dropdown on the top right of the report:
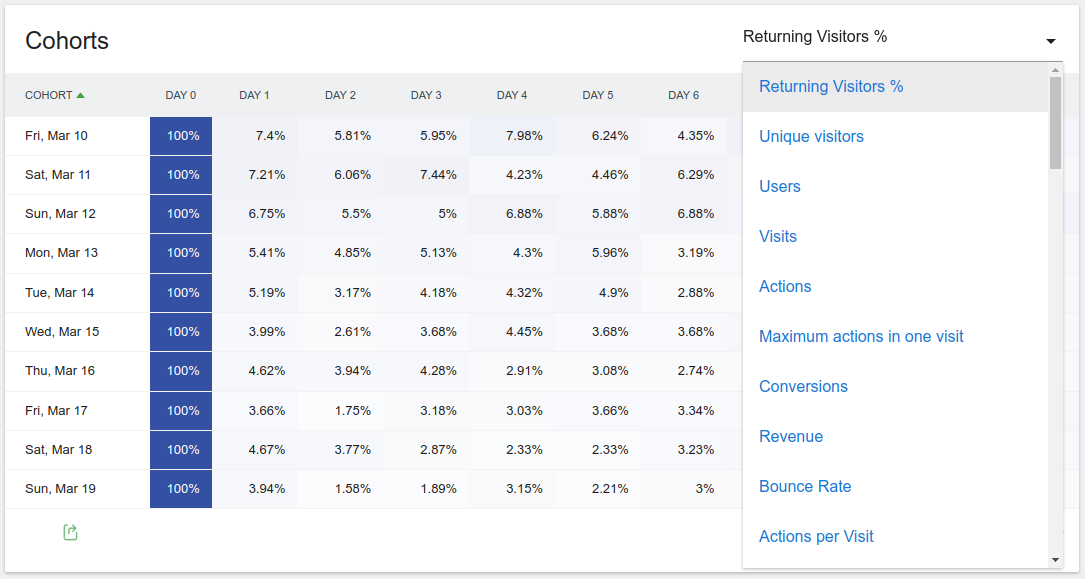
By default, the metric displayed is “Returning Visitors %”, which is the percent of visitors in the cohort that visited again for the column. This metric can be used to see when users stop visiting your website.
Note: when you change the metric Matomo will remember and load that metric the next time you view the report. User based reports are available only for daily and weekly reports.
Viewing cohorts by different periods
To view cohorts in week, month or year periods, simply select that type of period in the period selector:
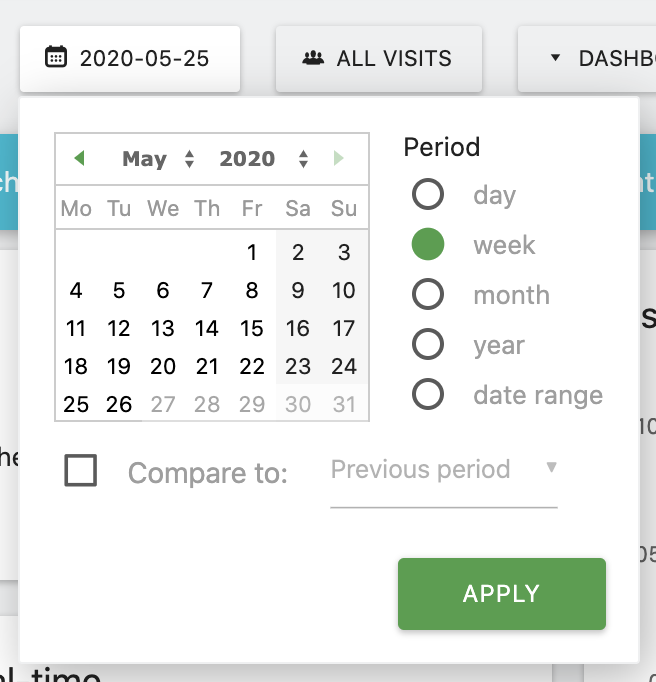
Cohorts are always defined by the currently selected period.
What can I learn from Cohorts report?
Grouping visitors by their acquisition date allows you to see how your retention rates respond to your business activities.
View the report for dates on which something important took place and see how they affected your ability to keep
your users around. For example, let’s say you’re building an webapp, and released a new feature that had been requested often. You can load the cohorts report for dates around the day of the release to see if your churn rate lowered.
You can also use the report to explain changes in your visitors’ engagement on certain days. Let’s say you’re running a blog and your retention rate halved on a specific day. Maybe some or all of the content produced on that day isn’t what your audience is interested in.
Finally, you can view the cohorts report for different segments to compare how engaged different types of visitors are. For example, you may find your engagement for Microsoft Edge users to be much lower than Chrome users, due to your website doing certain advanced things that are supported by Chrome, but not Microsoft Edge.
As always, you have to be creative with how you explore your data, but if you have questions about your engagement, this report is where you should start looking for answers.
Segmenting By Cohort
In addition to the Cohorts reports, there will be a new segment available, visitorFirstVisitTime, which can be used to view other Matomo reports for an individual cohort:
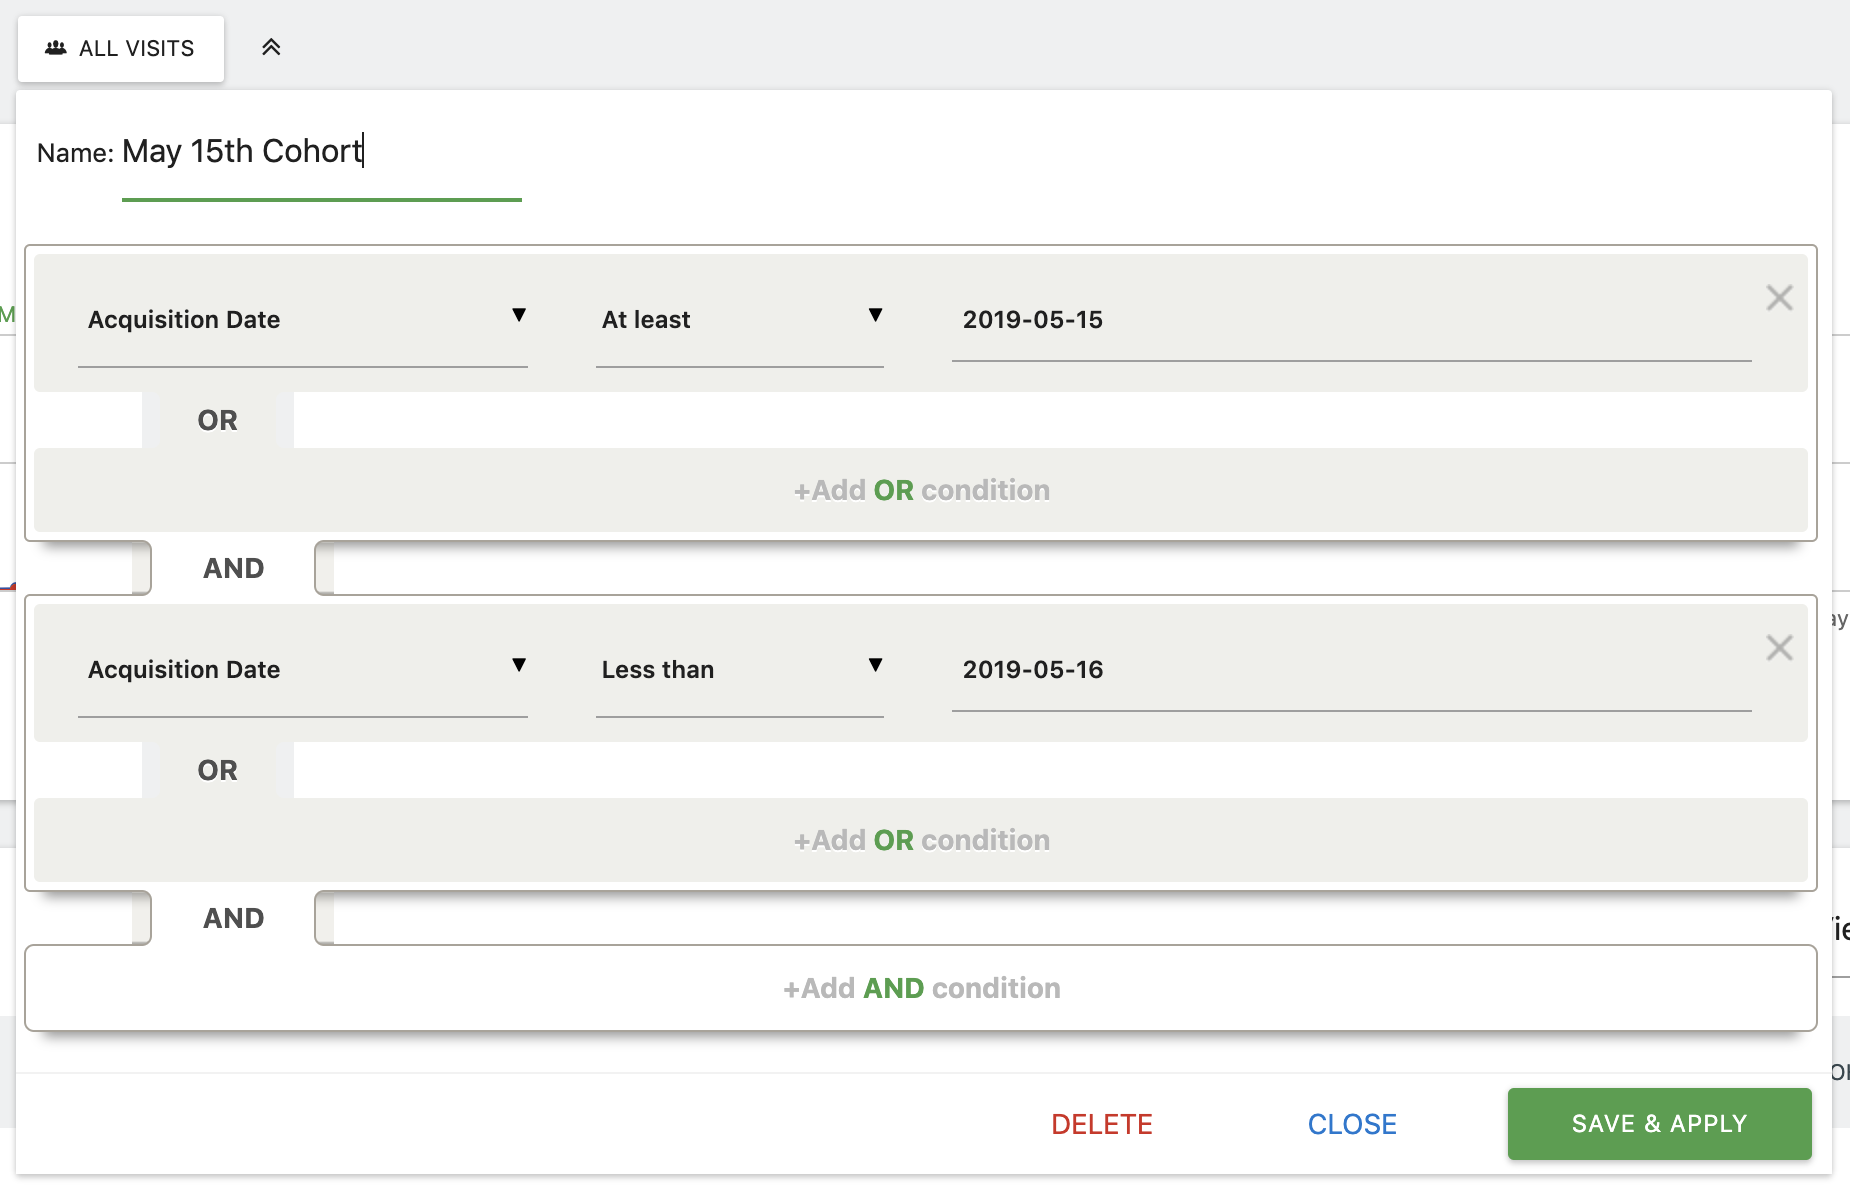
In the above example, we’re creating a segment that allows us to look at reports for visitors whose first visit was on May 15th, 2019.
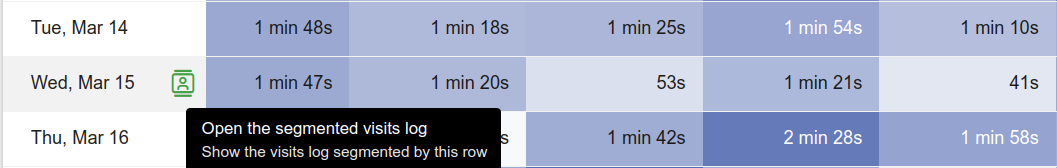
You can also create a segment for a cohort using the Cohorts report itself. In each row in the label for the cohort,
there will be an icon that launches the Segmented Visitor Log:
Click it to launch the Segmented Visitor Log. At the bottom of the popup there will be a button with the segment selector icon:
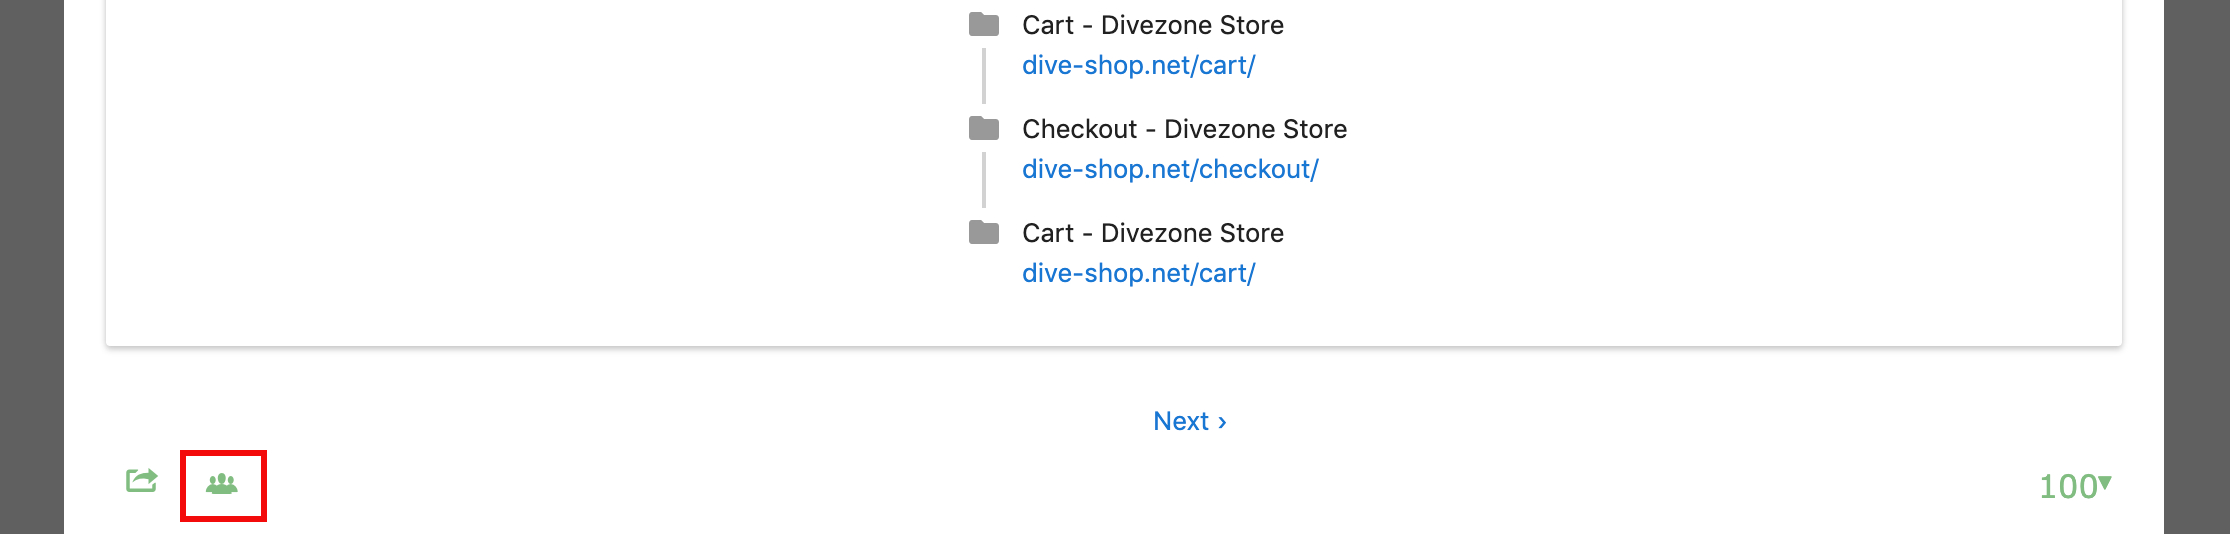
If you click that icon, a new tab will appear with the segment editor opened and filled with a segment definition for the cohort you selected. You can now easily save the segment and view Matomo reports for that individual cohort.
What can I learn from segmenting my Cohorts?
Segmenting by cohort is where the real power of cohort analysis lies. Once you’ve used the report in the previous section to identify interesting cohorts, you can then create a segment for that cohort, and drill down into the specifics of their behavior.
If you run an ecommerce store and see that visitors who were acquired on a specific day rarely come back to spend money, viewing other reports for those poor performing visitors may help you find an explanation. You could even go further and compare the reports of this poor performing cohort with other cohorts that have repeatedly made purchases.
How do I get historical Cohorts reports?
After you install and activate the feature, you can then invalidate and reprocess your historical data (for example the last 3 months) and get the Cohorts reports data in the past.
Tracking Setup
If you are using the JavaScript tracker, then you don’t need to do anything to get your Cohorts reports. In most cases this feature works without needing to do anything extra.
If you are using another tracker, such as the PHP tracker or are tracking within a mobile app, then you’ll need to make sure you are sending one specific piece of information.
The Cohorts plugin requires that the _idts query parameter is sent along with every tracking request. This parameter must be set to the timestamp of the visitor’s first known visit. In most cases this will require you save this time somewhere (as an example, the JavaScript tracker uses a cookie for this).