Analyse User ID reports
You can access the User IDs report within the Visitors section of the main navigation within Matomo. This report will show you a table of all registered User IDs that have interacted with your site during the selected reporting period. It also shows the number of visits and actions completed by each user, as well as, whether or not the user converted at least one goal.

The User IDs table can also be updated to include more engagement metrics. To do this, hover your mouse over the table so the icons menu appears in the bottom left and click on the table icon ![]() to reveal visualisation options. Then click on Display a table with Visitor engagement metrics. This will update the report to include additional columns, so you can analyse the following metrics in one view:
to reveal visualisation options. Then click on Display a table with Visitor engagement metrics. This will update the report to include additional columns, so you can analyse the following metrics in one view:
- Visits – How many times did each user visit your site within the reporting period?
- Actions – How many actions have they taken on your site? This could include page view, searches, downloads or clicks on your links to external sites.
- Actions Per Visit – How many of these actions did they take on an average visit?
- Avg Time on Website – What is the average amount of time the user spent on your site for each unique visit?
- Bounce Rate – The percentage of the users’ visits where they only viewed a single page.
- Conversion Rate – The percentage of the users’ visits where they completed a Goal.
The above statistics are useful for analysing your groups of users, but it is also possible to get even more granular data for a single user. If you hover your mouse over any of the User ID rows, you will see three green icons appear. Clicking on any of these will allow you to dig even deeper into visits by that user.

View Visitor Profile
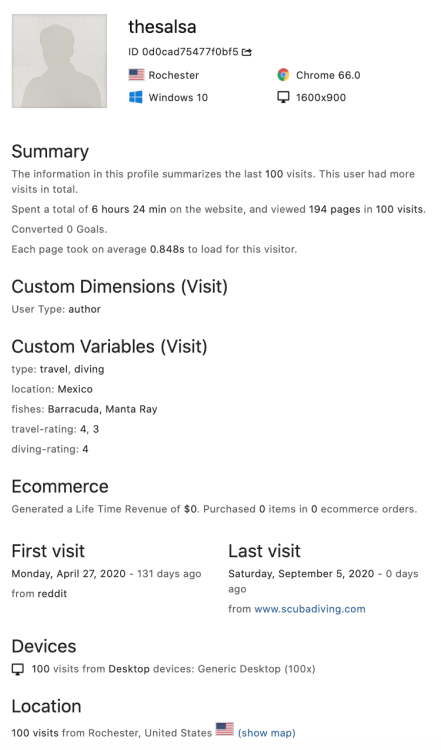
When you click on the user profile icon ![]() a Visitor Profile will load containing extended details about a user. It features details such as their location, device and browser usage, number of visits, any custom dimensions or variables, Ecommerce value, and a full breakdown of their visits to your site. This feature can help you build customer profiles to identify where you may be able to offer more value.
a Visitor Profile will load containing extended details about a user. It features details such as their location, device and browser usage, number of visits, any custom dimensions or variables, Ecommerce value, and a full breakdown of their visits to your site. This feature can help you build customer profiles to identify where you may be able to offer more value.
Open Segmented Visits Log
Clicking on the segmented visits log icon ![]() displays a paginated log of all visits associated with the unique User ID.
displays a paginated log of all visits associated with the unique User ID.

Open Row Evolution
Click on the row evolution icon ![]() to load an Evolution Graph, where you can explore the user’s engagement over time. You should also keep an eye out for potential issues on your site. For example, if you notice dips in traffic trends that coincide with annotated changes on your website.
to load an Evolution Graph, where you can explore the user’s engagement over time. You should also keep an eye out for potential issues on your site. For example, if you notice dips in traffic trends that coincide with annotated changes on your website.

Create a segment for logged-in users
Segmentation is a powerful tool for analysing groups of visitors to your site based on specific criteria. When paired with the User ID feature, you can easily create a segment based on logged in users. Learn more about how to create and analyse segments by User ID.

This segment can be useful for analysing whether logged in users interact with your site differently from logged out users. It can also help you understand trends for what is likely to be your most valuable users.
Explore additional topics on setting up User ID tracking and report analysis.