
Heatmap software
Website heatmap software that respects privacy
See how visitors behave while keeping your data private.
With Matomo Heatmaps, marketing and web teams can improve high-traffic websites while feeling confident about GDPR-compliance.

⭑ 4.7

⭑ 4.2

⭑ 4.7
Trusted by 1 million organisations worldwide





Three ways to understand your visitors
Reveal more insights than simple traffic numbers with Click, Scroll and Mouse Move heatmaps.
Click heatmap
Are your visitors clicking on what you want them to, or are they interacting with non-clickable elements? See which links and buttons earn clicks, and which non-clickable elements are being clicked on by visitors.
Scroll heatmap
Are too few visitors getting to your pricing table at the bottom of the page, or is there a drop-off before the most important content? These insights tell you where you may need to move, shorten, or reprioritise your content. See how far visitors scroll, making sure your key message and CTAs are seen.
Mouse Move heatmap
Know more than which pages your visitors explore and see where their cursor movement concentrates, empowering UX designers to enhance usability and engagement.

How Matomo turns clicks and scrolls into a clear behaviour map
Matomo turns visits into Click, Scroll, and Mouse Move Heatmaps, so you can see what people actually do, not just how many showed up. Maps can be built from cookieless, first-party data you fully own.
- Find the CTAs your visitors miss: Are users clicking on secondary links, images, or even decorative elements instead of your CTA? Are there any nearby elements competing for interaction? Matomo’s Click Heatmaps can show you where your visitors interact, identifying which elements visitors think are interactive. With these insights, you’ll know whether or not you need to move or strengthen your CTA, reduce competing links, or revisit your visual hierarchy.
- See where visitors stop scrolling: You have a nice page with your key selling points, contact forms, and pricing, but you’re not sure if your visitors are getting the message? Check how far page reach goes. Are your visitors even getting to your most important content? Matomo’s Scroll Heatmaps provide an average above-the-fold position and device-specific views. Use them to know which key information should be higher up and whether or not your CTA should really be at the end of the page. Your content shouldn’t delay the next step, and with Scroll Heatmaps, you can see where page reach falls.
- Find confusing page elements: Are your users clicking on non-clickable elements? You don’t want interactions congregating around passive elements, especially at the cost of your interactive elements. Think critically about your page elements through how users click on them. Is it time to go back to basics, simplify your interface, and remove misleading visual cues? Investigate these problems and come up with insight-driven solutions.
- Compare behaviour across visitor segments: Aggregate heatmaps can hide key differences between audience types. For example, desktop, tablet, and mobile behaviour can differ. This is partly due to the differing viewport widths. You can’t know whether a page is really working well for desktop users but tripping up mobile users if you don’t look into it. And have you thought about the differences between paid and organic traffic? New and returning visitors can also show differing behaviour. Use Matomo’s segments to gain insights and improve platform-specific page layouts without the risk of needlessly changing high-performing layouts. Use these insights to better target high-value audience groups with adapted content and prioritise your segments with the greatest conversion opportunities.
Turn behaviour into conversions
Used alongside funnels and A/B testing, heatmaps can replace opinions with evidence. This means design decisions are supported by what real visitors do, and CRO experiments target the friction that might be costing you revenue.
- Improve form completion: Use heatmaps to see whether visitors reach your forms, interact with them, or rather get distracted by nearby elements that compete for their attention. Heatmaps are useful for form interactions, while Form Analytics should be used for identifying individual field problems. For example, visitors reaching the form and clicking on passive elements may suggest it’s time to simplify the layout, clarify instructions, or use Session Recordings and Form Analytics to investigate further.
- Optimise landing page layouts: Your landing page might have all the right information just in the wrong order. Click activity, scroll reach, and mouse movement will show you some of the ways users interact with CTAs, explore benefits, and move towards key messaging or imagery. With these behavioural insights, you can make more informed decisions to reorder benefits and proof, move the CTA, or simply make the page easier to use.
- Reduce drop-off on long pages: If you have a long product, service, or ecommerce page with lots of delivery information, customer reassurance, or pricing details, there’s a risk that your visitors drop off before they even reach the “Add to basket”. Use heatmap insights to know when you should move purchase-critical information higher, introduce a repeated CTA, shorten a slow opening section, bring reassurance closer to the buying decision, or even remove sections that delay the next step.
- Validate A/B test results visually: A heatmap won’t validate whether your A/B tests have a statistically reliable winner, but it can explain how visitors interact with each version. You can compare interaction and scroll patterns to see how CTAs attract clicks and how many users are reaching them. It isn’t about seeing the results of the test; it’s about learning what you can carry into your next campaign or redesign.
- Prioritise high-impact redesigns: Too many design discussions are driven by gut feeling alone. Instead, base your redesign decisions on evidence like unintended clicks, ignored CTAs, and content that sits beyond common scroll reach. Heatmaps can help teams identify likely friction points to spend resources on during a rebranding.
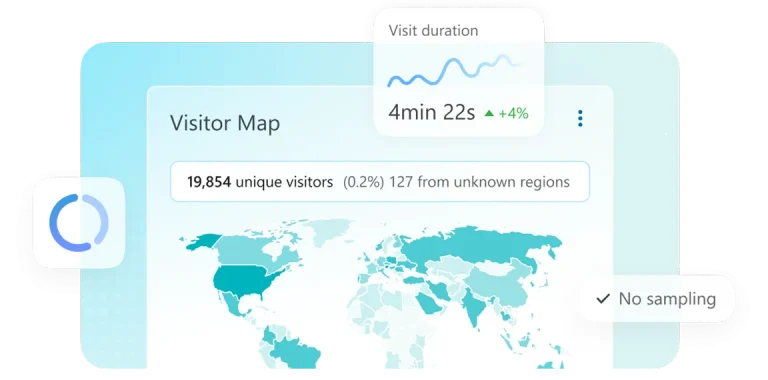
Heatmaps that don't leak your data.
Matomo keeps your data on your own servers or EU-based cloud. Features like IP anonymisation, and a built-in GDPR manager let you run Heatmaps compliant with GDPR, CCPA, and HIPAA.
Matomo doesn’t feed your data into advertising ecosystems, combine it with other customers’ data, or reuse it for its own commercial purposes. Your heatmap data is there to improve your and your visitors’ experience, not to support advertisers.
With Matomo On-Premise, you host your data yourself, for maximum control.
You can also apply data-retention and deletion settings, and export Heatmap and Session Recording reports through the API anytime.
100% data ownership
GDPR · CCPA · HIPAA
Self-hosted or EU cloud
Start using heatmaps in three steps
Install tracking code
One snippet, or a one-click install. You can add the Matomo tracking code to the pages you want to analyse or connect through a supported CMS integration like WordPress.
Select pages to track
Pick which URLs to record and set a sample size. Heatmaps build automatically as visits come in on conversion-critical pages like campaign landing pages, pricing pages, product pages, or checkout and sign-up pages.
Read the insights and act
Read the maps, segment by device or source, and feed findings into A/B tests and funnels. Review click, move, and scroll patterns and know when to move a missed CTA, shorten a page, make a frequently clicked image interactive, or investigate a mobile-specific problem.
Once they have access, agencies can configure and manage heatmaps without developer support or changes to the website code. This keeps client involvement to a minimum and allows you to act quickly when needed.
Choose Matomo Cloud or On-Premise
Matomo Cloud
Included
- Quick to start Enjoy a 21-day trial of Heatmaps and all other Matomo features, with no credit card required.
- EU-hosted Analytics data is stored in Frankfurt, Germany, with backups stored in Dublin, Ireland.
- Fully managed Matomo handles hosting, maintenance, automatic updates, security monitoring, and daily backups.
- Subscription-based Pricing based on monthly traffic. Pay monthly or annually, with a 17% saving for annual plans.
Matomo On-Premise
Paid add-on
- Matomo for free Start your analytics journey at no cost. And use our extensive Marketplace to fully tailor Matomo to your needs.
- Self-hostedInstall Matomo on your own server. Manage its hosting, updates, security, and performance.
- Full data sovereigntyChoose the servers and country where your analytics data is stored. Matomo has no access to your self-hosted data.
- Built for strict requirementsControl sensitive analytics with the rigour required in regulated industries like banking, insurance, government, and defence.
Explore more Matomo features
Combine Heatmap insights with Matomo’s features for diagnosing, testing, and improving performance.
What teams see with Matomo heatmaps
Real wins from teams using behaviour analytics that respect privacy.
⭑⭑⭑⭑⭑
“Matomo’s detailed tracking showed that users were scrolling down and interacting with the banner, which made it much easier for us to refine our design.”

UX Designer, Stockholm University
⭑⭑⭑⭑⭑
“What distinguishes Matomo from other web analytics solutions is, above all, respect for privacy and GDPR compliance. Protecting our users and focusing on data privacy is very important to us.”

CEO, Mandarine Academy
⭑⭑⭑⭑⭑
“Now we feel we have data that we’re confident in to evaluate and update our strategy. We can tell which blogs, efforts, initiatives, affiliates, referrals, etc., and we make better decisions.”

Marketing Manager at Barn2 Plugins
Learn more
Go deeper on the topic with our guides and resources.

All-in-one analytics vs connected analytics stack: How to choose

The AI visibility gap: What happens before the website visit?

Do you really control your analytics data? A practical analytics data governance checklist
Frequently Asked Questions
What is a website heatmap tool?
A website heatmap tool creates a visual overlay of aggregated visitor interactions on a page. Click maps show where people click, Scroll maps show how far visitors scroll on a page, and mouse move heatmaps provide cursor activity data. Session recordings follow a single visit, while a heatmap is a combination of behaviour data from many visits to provide patterns you can use to improve layouts, content and calls to action.
Are Matomo heatmaps GDPR compliant?
Matomo Heatmaps can be configured to support GDPR compliance. Installing the feature doesn’t automatically make a website compliant since compliance depends on configuration, implementation and the organisation’s legal obligations. Matomo provides consent controls, data masking and privacy settings, and Heatmap data remains within the Matomo Cloud or On-Premise environment.
Do heatmaps use cookies?
Matomo Heatmaps support cookieless tracking. When Session Recordings are enabled, the plugin sets a first-party _pk_hsr cookie for the duration of a visit so page views can be connected within the recording.
How does Matomo compare with Hotjar for heatmaps?
Both Matomo and Hotjar offer heatmaps and session recordings. Matomo also offers behaviour analytics, web analytics, and a choice of EU-hosted Matomo Cloud and self-hosted Matomo On-Premise. Hotjar is hosted on AWS infrastructure in Ireland, making Matomo a good fit when you need self-hosting, raw-data access, and infrastructure control.
Do heatmaps slow down my website?
Performance will depend on your site and configuration. Matomo’s JavaScript tracking loads asynchronously, and the Heatmaps and Session Recording plugin only adds its tracking code when required. You should test the implementation before and after launch using your normal performance-monitoring tools.
See what your visitors really do
Start mapping clicks and scrolls today, with Matomo Cloud free for 21 days, and no credit card required.
Full behaviour insight. Your data stays yours.