How do I configure and view Matomo data in Looker Studio?
Looker Studio is a powerful tool that allows you to pull data from multiple sources and use that data to create detailed, customised reports. The Matomo Analytics Connector for Looker Studio makes your Matomo reports available in Looker Studio.
Having your Matomo metrics available in Looker Studio can open up new possibilities in your data analyses:
- Blend your Matomo data with entirely different data sources and gain insights across your entire organisation.
- Use one of the many community visualisations available to display your data exactly the way you want.
- Create reports that focus specifically on the data that’s most important to you and the users of your reports.
If you’re a user of Looker Studio and would like to use your Matomo data in the reports you create, this guide will show you how.
Matomo Connector for Looker Studio Requirements
Before you use the Matomo Connector for Looker Studio, please make sure you fulfill the following requirements:
- The connector will work with many versions of Matomo, but will work best with Matomo version 4.14 or later. Your data will still display if you have a pre-4.14 version, but your metrics will not be formatted correctly, and you will find it harder to manipulate them.
- You should have a note of the URL you use for Matomo as your Matomo URL is used as a username when connecting to Looker Studio.
- You will need to create a
token_authin your Matomo prior to using the connector. You can create the token by following the steps in this FAQ - And of course, you will need a Google account from which to access Looker Studio.
Connecting to your Matomo data and adding your first report
To use the Matomo Connector for Looker Studio, you’ll want to follow Looker Studio’s workflow for adding a new data source.
-
Open the report you would like to add the Matomo Connector to. Locate the Add Data button and click it.

-
Within the connector search sheet that loads, search for Matomo Analytics.

-
There will be several third party connectors for Matomo, be sure to select the official one, that states it is created By Matomo.

-
Click Authorize to enable the Matomo Connector for Looker Studio. Note that the connector will only access Matomo reports to process your requests in Looker Studio. It will not collect your email address or any other other personal information from your Google account.

-
Provide your Matomo credentials so the connector can access your Matomo instance and then click submit.
- For the Username, enter the full URL to your Matomo instance, starting with
https://, for examplehttps://matomo.myorganization.com/. - For the Token, enter the auth token you have already created for the Looker Studio connector, or you can create an auth token by following the steps in this FAQ.

A note on security: entering these credentials will allow the Matomo Connector to get your data to Looker Studio, but we, the authors of the connector and Matomo, will not access your Matomo data. Your confidential credentials to Matomo are only directly accessible to the user that enters them. The Matomo Connector for Looker Studio will only access your credentials when requesting data from the target Matomo and for the purpose of generating your Looker Studio dashboards. If you’d just like to test out the connector, you can use our public demo by connecting tohttps://demo.matomo.cloud/. Enteranonymousas the Token.
- For the Username, enter the full URL to your Matomo instance, starting with
-
Select the Website/Measurable you would like to connect to and click Next.

-
You should now be able to see the configuration workflow where you’ll be able to connect the report.

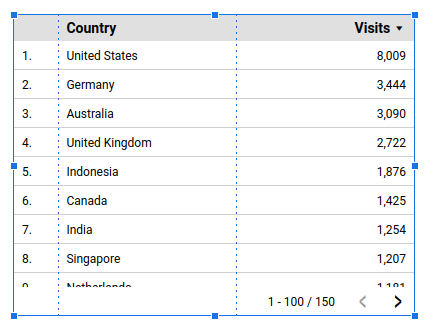
- For Report, select the report you would like to see in Looker Studio. As an example, we’ll select the
Visitors > Countryreport.
Note: due to the way Looker Studio works the connector can only connect you to a single report, but you can configure multiple data sources to get around this. We’ll show you how in the next section of this guide.) - For Segment, select the segment you’d like data pulled from. By default, the connector will get data from the All Visits segment, but you can change this if you’d like.
- (Optional) You can also make the segment parameterisable by checking the
Allow “Segment” to be modified in reports.checkbox:

This will allow report creators to change the segment, without having to configure a new data source. - The last option,
Default Row Limit, you can most likely ignore. (By default the connector will fetch all the data for a report, but if your specific Matomo report is especially large, you may run into some of Looker Studio’s limits. In this case, you would need to set a limit on the number of rows that are fetched here, but you don’t have to think about this now. It’s something you can always come back to if it turns out to be a necessity.)
- For Report, select the report you would like to see in Looker Studio. As an example, we’ll select the
-
Once you’ve selected your report and segment, click the Add button in the bottom right of the screen. If a modal pops up asking you to confirm whether you want to add the connector to your report, confirm.

Once you’ve completed all of the steps successfully, your new data source will be available within the Data panel.
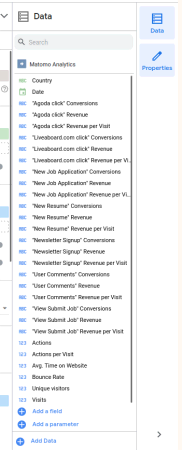
You can now create charts with it by dragging metrics and dimensions to your report canvas:
Adding a second report
To make a second Matomo report available in Looker Studio you’ll have to create a new data source with the new report. The process is identical to the above steps.
Follow the steps above again, and you should then see two data sources available in your Looker Studio report. If you do not see the new data source, you may have to close and re-open the data panel to load the new data.
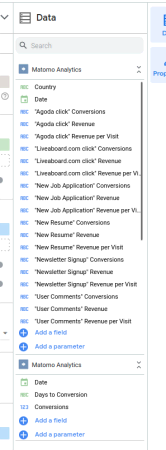
Note that both sources are named Matomo Analytics. This can be confusing and can make it harder to look for the specific data source you may need at a time. So let’s go ahead and rename it.
Renaming your Matomo Reports in Looker Studio
Click the edit button that looks like a pencil next to one of the data sources:
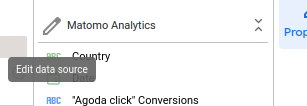
In the upper left of the popup, you’ll see the name of the connector. You can click on it and type in an alternative title. We recommend that you edit it to include a better description of the specific report. For example, Matomo Analytics (Country).
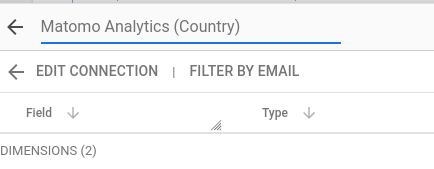
Click Done or Finished and the name change will be saved.
What to do next?
Now that you’ve connected Matomo to Looker Studio, you can craft dynamic time series reports to inform decision-making. To learn more about this, read our guide on creating time series charts in Looker Studio here.