
Everyone wants their website to rank highly in Google, which is exactly why the world of SEO is so competitive. Since search engines are how most people discover new sites, ranking well for the right search terms is now essential for digital marketing and business growth.
To succeed in such a crowded space, it’s essential to equip yourself with the right tools and processes to ensure your website is fully optimised for search engines.
To improve your website’s search rankings, SEO web analytics is a great place to start. It provides valuable insights to help you assess website performance, user behaviour and optimisation opportunities.
The basics of SEO web analytics
Before we discuss how to use web analytics for SEO, let’s start with a quick explanation of both:
- SEO (Search Engine Optimisation) encompasses a broad set of activities that aim to improve a website’s position in search engine results pages (SERPs).
- Web analytics is the process of collecting, analysing and reporting on data from your website. It helps you understand where traffic comes from and how users behave.
SEO web analytics combines the two terms. It involves using SEO-related web analytics data to enhance your site’s performance in search engines.
The importance of SEO website analytics
Search engine algorithms evaluate hundreds of ranking factors to determine your site’s position in the SERPs. Web analytics tools let you measure and optimise the specific website-related factors that influence your rankings.
These include factors like:
- User engagement
- Technical performance
- Keywords and organic search traffic
Tracking SEO web analytics helps understand what you’re doing well and where you can improve.
For example, analytics can highlight a technical issue, such as a slow-loading page with high bounce rates.
This takes SEO from an intuition-led approach to a systematic, data-based strategy.
What to track: 7 key SEO performance metrics
When performing an SEO web analysis, you’ll want to focus on the factors and metrics that impact your rankings.
We recommend starting with these seven analytics metrics that reveal where your website loses rankings and how to recover them.
1. Bounce rate and dwell time
Bounce rate and dwell time are user engagement metrics that tell you whether visitors think your content is relevant and worth exploring further.
| Metric | Definition | Signals |
| Bounce rate | Percentage of visitors who leave after viewing only a single page. | Relevance Quality |
| Dwell time | How long someone spends on a page before returning to their search results | EngagementReader value |
- Low bounce rates
- Suggest that visitors find your content relevant and want to engage with your site.
- Have a positive effect on rankings.
- High bounce rates
- Suggest to search engines that the page content isn’t relevant
- Have a negative effect on rankings.
- Long dwell times
- Suggest that visitors find your content engaging, interesting and/or useful.
- Have a positive effect on rankings.
- Short dwell times
- Suggest the page content doesn’t meet visitor expectations.
- Have a negative effect on rankings.
With advanced SEO analytics tools like Matomo, you can track bounce rate and average time on page in the Pages report:
Bounce rate and average time on page via Pages report
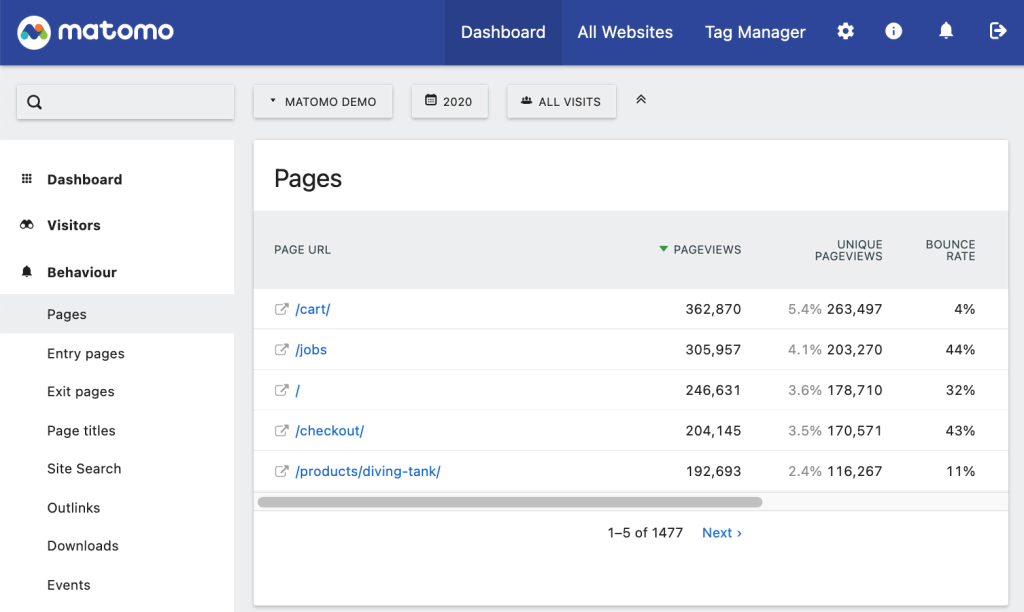
If most users leave your site after a few seconds, Google will likely infer the content isn’t relevant and push your page further down in the rankings.
To lower bounce rates:
- Improve the quality of your content: Focus on clarity, depth and addressing the search intent.
- Review performance: Slow-loading pages can contribute to bounce rates.
- Fix technical issues: Address broken links and 404 errors.
- Optimise metadata: Update page meta titles and descriptions, and add titles and alt tags to images and other visual elements.
By upgrading metadata and improving content quality to better meet user expectations, you can lower bounce rates, boost dwell times, and increase search visibility.
2. Broken links
Broken links are hyperlinks that lead to 404 pages or non-existent content. They disrupt the customer journey and frustrate users who can’t find what they’re looking for.
| Area | Broken link impact |
| User experience | Visitors lose trust when pages don’t work, making them less likely to return. |
| SERP ranking | Broken links are a sign of poor site health to search engines, which can hurt rankings. |
| Site reliability | Frequent crawl errors signal instability and reduce confidence in your content. |
Search engines want to provide reliable, trustworthy search results. One of the ways they accomplish that is by penalising sites that contain broken links or seem otherwise unreliable.
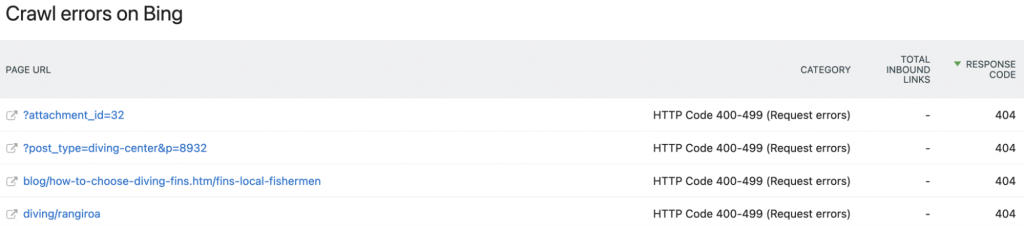
404 errors via the Crawling Errors report
To resolve broken links:
- Redirect pages to relevant content.
- Update the link with the correct URL.
- Create replacement content.
- Remove the link completely.
It’s a good idea to perform periodic reviews of your site. With Matomo, you can create automatic crawling error reports to stay on top of broken links and other issues.
3. Scroll depth
Scroll depth measures how far down the page visitors scroll. It helps you gauge the quality of your content and the extent to which visitors engage with it.
Search engines consider how visitors interact with your content, too. If people scroll through and read a post from start to finish, it signals that it’s relevant and valuable.
You can measure scroll depth by creating a specific trigger with Matomo Tag Manager:
- Create a new tag.
- Select Matomo Analytics as the Tag Type.
- Select the Tracking Type as Event.
- Create a new trigger now and choose “Scroll Reach”.
- Rename the trigger to your desired scroll percentage (e.g., 25%, 50%, 75%, etc.).
- Create the trigger and tag.
- Publish the changes.
Scroll depth benchmarks
| 0 – 25% | Users don’t find your content valuable or relevant. |
| 25 – 50% | Users find your content moderately interesting, but not enough to keep reading. |
| 50 – 75% | Good engagement. Users are invested in your content. |
| 75 – 100% | Excellent engagement. Your content fully meets user needs. |
To improve scroll depth:
- Separate long articles (~3,000 words or more) into shorter pieces.
- Reorganise your content to place the most valuable information at the beginning.
- Use bullet points, subheadings and shorter sentences to make content more skimmable.
4. Transitions
Transitions track how visitors navigate through your website, moving from page to page. Understanding user transitions helps you gauge your on-page SEO and find internal linking opportunities.
If users are navigating your site effectively, your internal linking strategy is likely working. If not, you can add more links to improve visitor flow.
Track transitions with Matomo’s Transitions report. It tells you what visitors did immediately before and after viewing a specific page.
Previous and following actions of visitors for a website’s cart page via the Transitions report
Unlike other Clickpath tools, the Transitions report displays visitor origins and destinations, which makes it easier to track organic traffic, search campaigns, and how SEO content influences conversion rates.
5. Internal site search keywords
Internal site search shows what visitors type into your website’s search bar. It tells you what they’re looking for but can’t easily find.
Matomo’s Site Search Report ranks keywords by the number of searches they appear in:
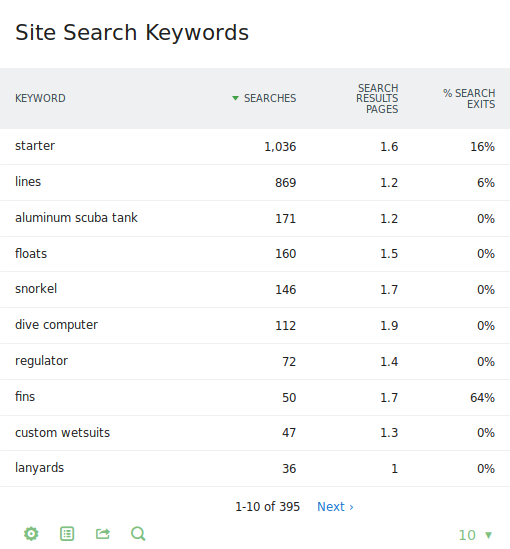
List of keywords via Site Search Keywords report
Site search can be incredibly valuable for SEO, as it helps identify content gaps. Users might use your site search for several reasons:
- Product information is missing or hard to find
- Your content doesn’t answer their questions
- There are entire topics you haven’t covered
Either way, it’s a clear signal to create the content they’re searching for. Just make sure you validate these keyword opportunities with data from other SEO tools to confirm search volume.
6. Segments
Segments separate website visitors into distinct groups based on shared characteristics. They let you analyse behaviour patterns for specific audiences.
Matomo lets you analyse the following visitor segments:
- Visit-based: New vs returning visitors, landing page differences
- Interaction-based: Users who completed goals/events vs those who didn’t
- Campaign-based: Behaviour patterns by traffic source or marketing campaign
- E-commerce: Purchasers vs non-purchasers, product-specific customer patterns
- Demographic: Location, language or custom dimensions
- Technographic: Device type, browser or platform differences
Audience segmentation lets you analyse which users convert best or engage most deeply with your content, allowing you to focus your SEO efforts on attracting more of those valuable visitors.
At the end of the day, it’s not necessarily about attracting as many visitors, but attracting the right kind of visitor.
7. Acquisition channels
Acquisition channels show where website traffic originates. It shows which marketing efforts drive visitors and how different sources affect user behaviour.
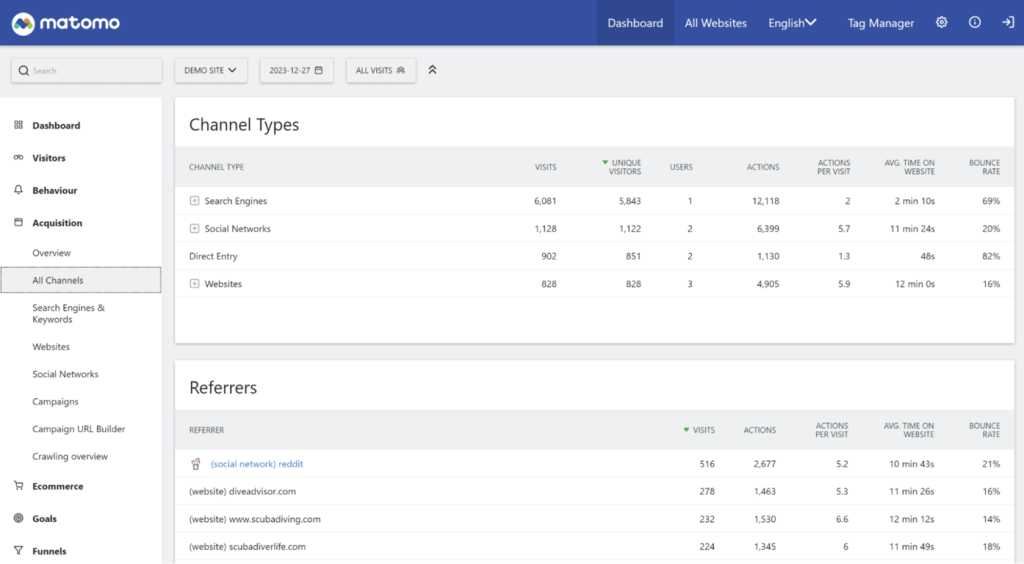
Referral websites via Matomo’s Websites report
Matomo’s Acquisition and Marketing Channels report splits traffic sources into several categories:
- Search engines: Organic search traffic from Google, Bing, Yahoo and others.
- Social media: Traffic from networks like Facebook, Instagram, YouTube, etc.
- Direct entry: Visitors who typed the URL directly.
- Campaign: Visitors from paid marketing efforts.
Tracking website traffic is one of the best ways to track organic search traffic growth over time and evaluate your optimisation efforts
In addition to the above, you should also be monitoring your Core Web Vitals, which brings us to our next section.
Improving the user experience with Core Web Vitals
Core Web Vitals are a set of three metrics that measure a site’s user experience across three dimensions: loading speed, interactivity and visual stability.
The three Core Web Vitals are:
- Largest Contentful Paint (LCP): the amount of time it takes the website’s largest element (an image or block of text) to load.
- Google recommends less than 2.5 seconds.
- Interaction to Next Paint (INP): How responsive a page is to user clicks, scrolls, and other interactions.
- Google recommends having an INP of less than 200 milliseconds.
- Cumulative Layout Shift (CLS): How much a page’s layout shifts when loading.
- Google recommends having a CLS score of less than 0.1.
Core web vitals are important because Google uses them to rank your page. The better you score, the higher you’ll rank (all else being equal).
You can track Core Web Vitals with a tool like Google’s PageSpeed Insights or Matomo’s SEO Web Vitals Report.
Please note, the SEO Web Vitals feature is exclusive to Matomo On-Premise and is not available in Matomo Cloud.
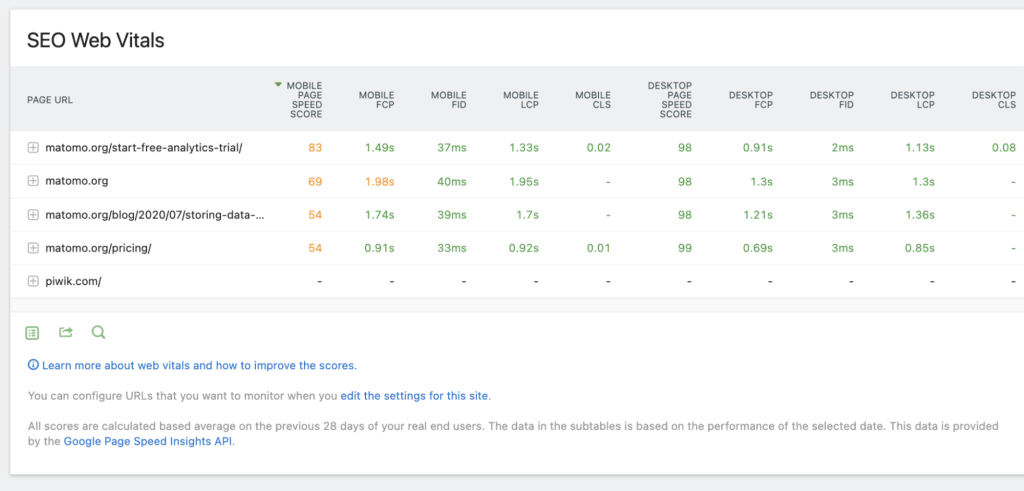
Matomo SEO Web Vitals report
You get a score for mobile and desktop performance that’s colour-coded:
- Green means the result is good
- Orange means it needs improvement
- Red means the result is poor and improvement is essential
In most cases, improving core vitals can be pretty straightforward. The table below provides optimisation suggestions for common issues with each metric:
Common issues | Optimisation techniques | |
LCP | Unoptimised images Slow server responsesRender-blocking resourcesLarge CSS/JS files | Reduce image sizesCDN to improve load speed Enable caching |
INP | Long JavaScript tasksHeavy event handlersThird-party scripts | Reduce JavaScript file sizesDelete third-party pluginsSimplify page structure |
CLS | Images without pre-defined dimensions Dynamic ads and bannersWeb font loading | Create ad placeholdersLoad important fonts firstAvoid layout-changing animations |
For more information on tracking Core Web Vitals and other performance metrics in Matomo, check out our SEO Web Vitals Guide.
Tracking keyword performance in your web analytics platform
A good web analytics platform will also let you track the SEO keywords your site currently ranks for.
For example, Matomo’s Search Engine Keywords Performance plugin integrates with Google Search Console to tell you all of the keywords you rank for in Google, Yahoo and Bing, as well as:
- The average position
- Clicks per keyword
- Impressions per keyword
- Click-through rate (CTR)
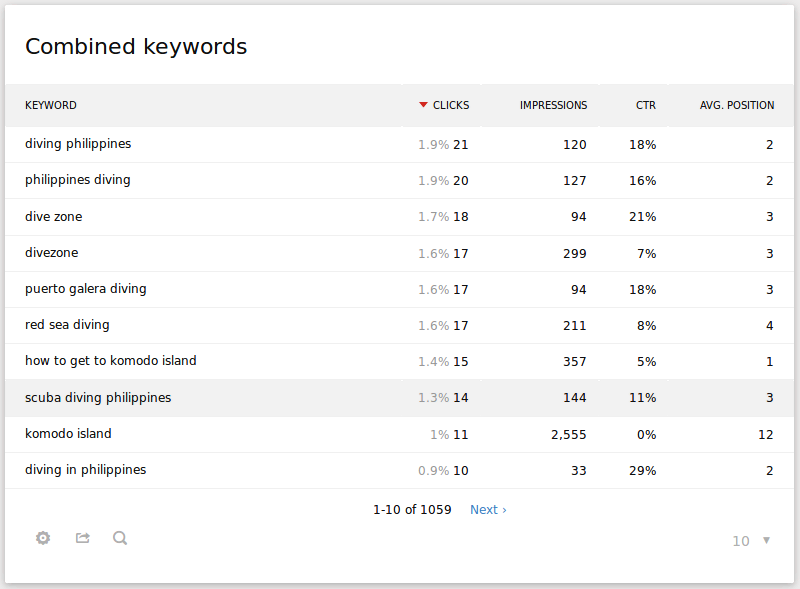
Top keywords generating traffic via Search Engines & Keywords report in Matomo
Analysing different aspects of keyword performance can help you identify opportunities to increase traffic and improve your rankings. Here are some common scenarios:
| Scenario | Action |
| High-performing target keywords | Build out keyword topic clustersCreate additional supporting content |
| Keywords with high impressions but low clicks. | Optimise meta title and meta description.Improve content quality. |
| Keywords averaging positions 11–20 | Run a targeted link campaign. Improve on-page SEO & content depth. |
| Keywords with declining positions & traffic | Technical SEO auditAnalyse top-ranking content. |
| High-ranking keywords with low impressions | Assess search volume. Target additional long variants. |
Not every web analytics platform gives you access to this data, however. That’s why it’s important to look beyond Google Analytics if you want to get the most from your SEO strategy.
Final thoughts
Effective SEO decisions require clarity. Unlike Google Analytics 4 and other platforms that rely on sampled data, Matomo gives you 100% unsampled, accurate metrics.
With a clearer picture of user behaviour and page performance, teams can focus their attention on the optimisations that will have the biggest impact on rankings and growth.
We’re a free, open-source analytics platform that gives you complete ownership, so you have complete visibility into and full control over your site data and your customers’ privacy.
Try our live demo, or start your 21-day free trial today (no credit card required).